Coca Cola 2014 Annual Report Download - page 107
Download and view the complete annual report
Please find page 107 of the 2014 Coca Cola annual report below. You can navigate through the pages in the report by either clicking on the pages listed below, or by using the keyword search tool below to find specific information within the annual report.-
 1
1 -
2
-
3
-
4
-
5
-
6
-
7
-
8
-
9
-
10
-
11
-
12
-
13
-
14
-
15
-
16
-
17
-
18
-
19
-
20
-
21
-
22
-
23
-
24
-
25
-
26
-
27
-
28
-
29
-
30
-
31
-
32
-
33
-
34
-
35
-
36
-
37
-
38
-
39
-
40
-
41
-
42
-
43
-
44
-
45
-
46
-
47
-
48
-
49
-
50
-
51
-
52
-
53
-
54
-
55
-
56
-
57
-
58
-
59
-
60
-
61
-
62
-
63
-
64
-
65
-
66
-
67
-
68
-
69
-
70
-
71
-
72
-
73
-
74
-
75
-
76
-
77
-
78
-
79
-
80
-
81
-
82
-
83
-
84
-
85
-
86
-
87
-
88
-
89
-
90
-
91
-
92
-
93
-
94
-
95
-
96
-
 97
97 -
 98
98 -
 99
99 -
 100
100 -
 101
101 -
 102
102 -
 103
103 -
 104
104 -
 105
105 -
 106
106 -
 107
107 -
 108
108 -
 109
109 -
 110
110 -
 111
111 -
 112
112 -
 113
113 -
 114
114 -
 115
115 -
 116
116 -
 117
117 -
118
-
119
-
120
-
121
-
122
-
123
-
124
-
125
-
126
-
127
-
128
-
129
-
130
-
131
-
132
-
133
-
134
-
135
-
136
-
137
-
138
-
139
-
140
-
141
-
142
-
143
-
144
-
145
-
146
-
147
-
148
-
149
-
150
-
151
-
152
-
153
-
154
-
155
-
156
-
157
-
158
-
159
-
160
 |
 |

105
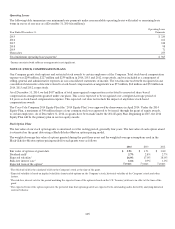
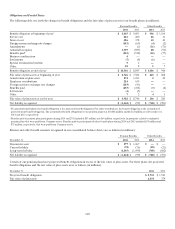
Operating Leases
The following table summarizes our minimum lease payments under noncancelable operating leases with initial or remaining lease
terms in excess of one year as of December 31, 2014 (in millions):
Year Ended December 31,
Operating Lease
Payments
2015 $ 230
2016 161
2017 128
2018 98
2019 71
Thereafter 277
Total minimum operating lease payments1$ 965
1 Income associated with sublease arrangements is not significant.
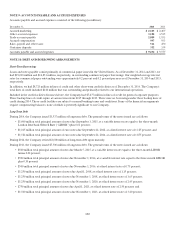
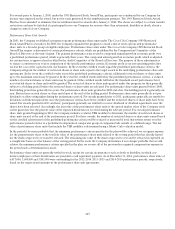
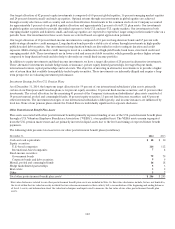
NOTE 12: STOCK COMPENSATION PLANS
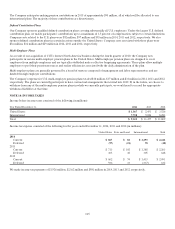
Our Company grants stock options and restricted stock awards to certain employees of the Company. Total stock-based compensation
expense was $209 million, $227 million and $259 million in 2014, 2013 and 2012, respectively, and was included as a component of
selling, general and administrative expenses in our consolidated statements of income. The total income tax benefit recognized in our
consolidated statements of income related to stock-based compensation arrangements was $57 million, $62 million and $72 million in
2014, 2013 and 2012, respectively.
As of December 31, 2014, we had $437 million of total unrecognized compensation cost related to nonvested share-based
compensation arrangements granted under our plans. This cost is expected to be recognized over a weighted-average period of
2.2 years as stock-based compensation expense. This expected cost does not include the impact of any future stock-based
compensation awards.
The Coca-Cola Company 2014 Equity Plan (the “2014 Equity Plan”) was approved by shareowners in April 2014. Under the 2014
Equity Plan, a maximum of 500 million shares of our common stock was approved to be issued, through the grant of equity awards,
to certain employees. As of December 31, 2014, no grants have been made under the 2014 Equity Plan. Beginning in 2015, the 2014
Equity Plan will be the primary plan in use for equity awards.
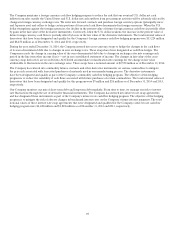
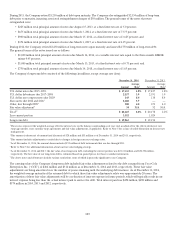
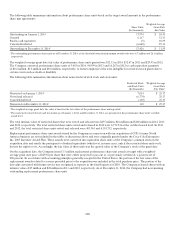
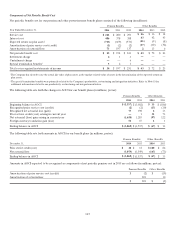
Stock Option Plans
The fair value of our stock option grants is amortized over the vesting period, generally four years. The fair value of each option award
is estimated on the grant date using a Black-Scholes-Merton option-pricing model.
The weighted-average fair value of options granted during the past three years and the weighted-average assumptions used in the
Black-Scholes-Merton option-pricing model for such grants were as follows:
2014 2013 2012
Fair value of options at grant date
$ 3.91 $ 3.73 $ 3.80
Dividend yield12.7% 2.8% 2.7%
Expected volatility216.0% 17.0% 18.0%
Risk-free interest rate31.6% 0.9% 1.0%
Expected term of the option4
5 years
5 years 5 years
1 The dividend yield is the calculated yield on the Company’s stock at the time of the grant.
2 Expected volatility is based on implied volatilities from traded options on the Company’s stock, historical volatility of the Company’s stock and other
factors.
3 The risk-free interest rate for the period matching the expected term of the option is based on the U.S. Treasury yield curve in effect at the time of the
grant.
4 The expected term of the option represents the period of time that options granted are expected to be outstanding and is derived by analyzing historical
exercise behavior.