Coca Cola 2014 Annual Report Download - page 39
Download and view the complete annual report
Please find page 39 of the 2014 Coca Cola annual report below. You can navigate through the pages in the report by either clicking on the pages listed below, or by using the keyword search tool below to find specific information within the annual report.-
 1
1 -
2
-
3
-
4
-
5
-
6
-
7
-
8
-
9
-
10
-
11
-
12
-
13
-
14
-
15
-
16
-
17
-
18
-
19
-
20
-
21
-
22
-
23
-
24
-
25
-
26
-
27
-
28
-
 29
29 -
 30
30 -
 31
31 -
 32
32 -
 33
33 -
 34
34 -
 35
35 -
 36
36 -
 37
37 -
 38
38 -
 39
39 -
 40
40 -
 41
41 -
 42
42 -
 43
43 -
 44
44 -
 45
45 -
 46
46 -
 47
47 -
 48
48 -
 49
49 -
50
-
51
-
52
-
53
-
54
-
55
-
56
-
57
-
58
-
59
-
60
-
61
-
62
-
63
-
64
-
65
-
66
-
67
-
68
-
69
-
70
-
71
-
72
-
73
-
74
-
75
-
76
-
77
-
78
-
79
-
80
-
81
-
82
-
83
-
84
-
85
-
86
-
87
-
88
-
89
-
90
-
91
-
92
-
93
-
94
-
95
-
96
-
97
-
98
-
99
-
100
-
101
-
102
-
103
-
104
-
105
-
106
-
107
-
108
-
109
-
110
-
111
-
112
-
113
-
114
-
115
-
116
-
117
-
118
-
119
-
120
-
121
-
122
-
123
-
124
-
125
-
126
-
127
-
128
-
129
-
130
-
131
-
132
-
133
-
134
-
135
-
136
-
137
-
138
-
139
-
140
-
141
-
142
-
143
-
144
-
145
-
146
-
147
-
148
-
149
-
150
-
151
-
152
-
153
-
154
-
155
-
156
-
157
-
158
-
159
-
160
 |
 |

37
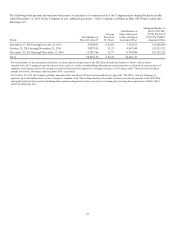
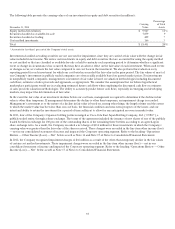
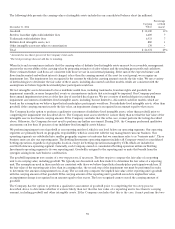
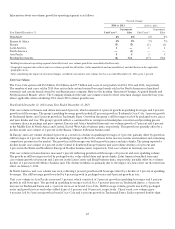
The following table presents the carrying values of our investments in equity and debt securities (in millions):
December 31, 2014
Carrying
Value
P
ercentage
of T
otal
Assets
Equity method investments $ 9,947
11%
Securities classified as available-for-sale 7,879 9
Securities classified as trading 409
*
Cost method investments 166
*
Total $ 18,401
20%
* Accounts for less than 1 percent of the Company’s total assets.
Investments classified as trading securities are not assessed for impairment, since they are carried at fair value with the change in fair
value included in net income. We review our investments in equity and debt securities that are accounted for using the equity method
or cost method or that are classified as available-for-sale or held-to-maturity each reporting period to determine whether a significant
event or change in circumstances has occurred that may have an adverse effect on the fair value of each investment. When such events
or changes occur, we evaluate the fair value compared to our cost basis in the investment. We also perform this evaluation every
reporting period for each investment for which our cost basis has exceeded the fair value in the prior period. The fair values of most of
our Company’s investments in publicly traded companies are often readily available based on quoted market prices. For investments
in nonpublicly traded companies, management’s assessment of fair value is based on valuation methodologies including discounted
cash flows, estimates of sales proceeds and appraisals, as appropriate. We consider the assumptions that we believe hypothetical
marketplace participants would use in evaluating estimated future cash flows when employing the discounted cash flow or estimates
of sales proceeds valuation methodologies. The ability to accurately predict future cash flows, especially in emerging and developing
markets, may impact the determination of fair value.
In the event the fair value of an investment declines below our cost basis, management is required to determine if the decline in fair
value is other than temporary. If management determines the decline is other than temporary, an impairment charge is recorded.
Management’s assessment as to the nature of a decline in fair value is based on, among other things, the length of time and the extent
to which the market value has been less than our cost basis, the financial condition and near-term prospects of the issuer, and our
intent and ability to retain the investment for a period of time sufficient to allow for any anticipated recovery in market value.
In 2013, four of the Company’s Japanese bottling partners merged as Coca-Cola East Japan Bottling Company, Ltd. (“CCEJ”), a
publicly traded entity, through a share exchange. The terms of the agreement included the issuance of new shares of one of the publicly
traded bottlers in exchange for 100 percent of the outstanding shares of the remaining three bottlers according to an agreed-upon
share exchange ratio. As a result, the Company recorded a net charge of $114 million for those investments in which the Company’s
carrying value was greater than the fair value of the shares received. These charges were recorded in the line item other income (loss)
— net in our consolidated statement of income and impacted the Corporate operating segment. Refer to the heading “Operations
Review — Other Income (Loss) — Net” below as well as Note 16 and Note 17 of Notes to Consolidated Financial Statements.
In 2012, the Company recognized impairment charges of $16 million as a result of the other-than-temporary decline in the fair values
of certain cost method investments. These impairment charges were recorded in the line item other income (loss) — net in our
consolidated statement of income and impacted the Corporate operating segment. Refer to the heading “Operations Review — Other
Income (Loss) — Net” below as well as Note 17 of Notes to Consolidated Financial Statements.