Coca Cola 2014 Annual Report Download - page 114
Download and view the complete annual report
Please find page 114 of the 2014 Coca Cola annual report below. You can navigate through the pages in the report by either clicking on the pages listed below, or by using the keyword search tool below to find specific information within the annual report.-
 1
1 -
2
-
3
-
4
-
5
-
6
-
7
-
8
-
9
-
10
-
11
-
12
-
13
-
14
-
15
-
16
-
17
-
18
-
19
-
20
-
21
-
22
-
23
-
24
-
25
-
26
-
27
-
28
-
29
-
30
-
31
-
32
-
33
-
34
-
35
-
36
-
37
-
38
-
39
-
40
-
41
-
42
-
43
-
44
-
45
-
46
-
47
-
48
-
49
-
50
-
51
-
52
-
53
-
54
-
55
-
56
-
57
-
58
-
59
-
60
-
61
-
62
-
63
-
64
-
65
-
66
-
67
-
68
-
69
-
70
-
71
-
72
-
73
-
74
-
75
-
76
-
77
-
78
-
79
-
80
-
81
-
82
-
83
-
84
-
85
-
86
-
87
-
88
-
89
-
90
-
91
-
92
-
93
-
94
-
95
-
96
-
97
-
98
-
99
-
100
-
101
-
102
-
103
-
 104
104 -
 105
105 -
 106
106 -
 107
107 -
 108
108 -
 109
109 -
 110
110 -
 111
111 -
 112
112 -
 113
113 -
 114
114 -
 115
115 -
 116
116 -
 117
117 -
 118
118 -
 119
119 -
 120
120 -
 121
121 -
 122
122 -
 123
123 -
 124
124 -
125
-
126
-
127
-
128
-
129
-
130
-
131
-
132
-
133
-
134
-
135
-
136
-
137
-
138
-
139
-
140
-
141
-
142
-
143
-
144
-
145
-
146
-
147
-
148
-
149
-
150
-
151
-
152
-
153
-
154
-
155
-
156
-
157
-
158
-
159
-
160
 |
 |

112
Our target allocation of 42 percent equity investments is composed of 60 percent global equities, 16 percent emerging market equities
and 24 percent domestic small- and mid-cap equities. Optimal returns through our investments in global equities are achieved
through security selection as well as country and sector diversification. Investments in the common stock of our Company accounted
for approximately 5 percent of our global equities allocation and approximately 2 percent of total U.S. plan assets. Our investments
in global equities are intended to provide diversified exposure to both U.S. and non-U.S. equity markets. Our investments in both
emerging market equities and domestic small- and mid-cap equities are expected to experience larger swings in their market value on a
periodic basis. Our investments in these asset classes are selected based on capital appreciation potential.
Our target allocation of 30 percent fixed-income investments is composed of 33 percent long-duration bonds and 67 percent with
multi-strategy alternative credit managers. Long-duration bonds provide a stable rate of return through investments in high-quality
publicly traded debt securities. Our investments in long-duration bonds are diversified in order to mitigate duration and credit
exposure. Multi-strategy alternative credit managers invest in a combination of high-yield bonds, bank loans, structured credit and
emerging market debt. These investments are in lower-rated and non-rated debt securities, which generally produce higher returns
compared to long-duration bonds and also help to diversify our overall fixed-income portfolio.
In addition to equity investments and fixed-income investments, we have a target allocation of 28 percent in alternative investments.
These alternative investments include hedge funds, reinsurance, private equity limited partnerships, leveraged buyout funds,
international venture capital partnerships and real estate. The objective of investing in alternative investments is to provide a higher
rate of return than that available from publicly traded equity securities. These investments are inherently illiquid and require a long-
term perspective in evaluating investment performance.
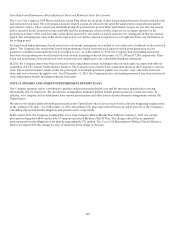
Investment Strategy for Non-U.S. Pension Plans
As of December 31, 2014, the long-term target allocation for 59 percent of our international subsidiaries’ plan assets, primarily
certain of our European and Canadian plans, is 66 percent equity securities; 23 percent fixed-income securities; and 11 percent other
investments. The actual allocation for the remaining 41 percent of the Company’s international subsidiaries’ plan assets consisted of
34 percent mutual, pooled and commingled funds; 10 percent equity securities; 13 percent fixed-income securities; and 43 percent
other investments. The investment strategies of our international subsidiaries differ greatly, and in some instances are influenced by
local law. None of our pension plans outside the United States is individually significant for separate disclosure.
Other Postretirement Benefit Plan Assets
Plan assets associated with other postretirement benefits primarily represent funding of one of the U.S. postretirement benefit plans
through a U.S. Voluntary Employee Beneficiary Association (“VEBA”), a tax-qualified trust. The VEBA assets remain segregated
from the U.S. pension master trust and are primarily invested in liquid assets due to the level and timing of expected future benefit
payments.
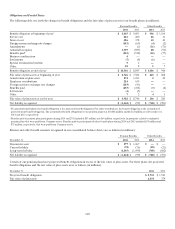
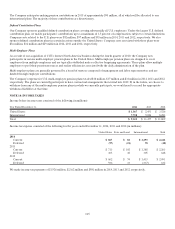
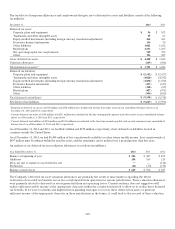
The following table presents total assets for our other postretirement benefit plans (in millions):
December 31, 2014 2013
Cash and cash
equivalents
$ 10 $ 10
Equity
securities:
U.S.-based
companies
114 112
International-based
companies
78
Fixed-income
securities:
Government bonds 79 79
Corporate bonds and debt
securities
99
Mutual, pooled and commingled funds 16 18
Hedge funds/limited
partnerships
53
Real
estate
32
Other 32
Total other postretirement benefit plan assets1$ 246 $ 243
1 Fair value disclosures related to our other postretirement benefit plan assets are included in Note 16. Fair value disclosures include, but are not limited to,
the levels within the fair value hierarchy in which the fair value measurements in their entirety fall; a reconciliation of the beginning and ending balances
of Level 3 assets; and information about the valuation techniques and inputs used to measure the fair value of our other postretirement benefit plan
assets.