Coca Cola 2014 Annual Report Download - page 57
Download and view the complete annual report
Please find page 57 of the 2014 Coca Cola annual report below. You can navigate through the pages in the report by either clicking on the pages listed below, or by using the keyword search tool below to find specific information within the annual report.-
 1
1 -
2
-
3
-
4
-
5
-
6
-
7
-
8
-
9
-
10
-
11
-
12
-
13
-
14
-
15
-
16
-
17
-
18
-
19
-
20
-
21
-
22
-
23
-
24
-
25
-
26
-
27
-
28
-
29
-
30
-
31
-
32
-
33
-
34
-
35
-
36
-
37
-
38
-
39
-
40
-
41
-
42
-
43
-
44
-
45
-
46
-
 47
47 -
 48
48 -
 49
49 -
 50
50 -
 51
51 -
 52
52 -
 53
53 -
 54
54 -
 55
55 -
 56
56 -
 57
57 -
 58
58 -
 59
59 -
 60
60 -
 61
61 -
 62
62 -
 63
63 -
 64
64 -
 65
65 -
 66
66 -
 67
67 -
68
-
69
-
70
-
71
-
72
-
73
-
74
-
75
-
76
-
77
-
78
-
79
-
80
-
81
-
82
-
83
-
84
-
85
-
86
-
87
-
88
-
89
-
90
-
91
-
92
-
93
-
94
-
95
-
96
-
97
-
98
-
99
-
100
-
101
-
102
-
103
-
104
-
105
-
106
-
107
-
108
-
109
-
110
-
111
-
112
-
113
-
114
-
115
-
116
-
117
-
118
-
119
-
120
-
121
-
122
-
123
-
124
-
125
-
126
-
127
-
128
-
129
-
130
-
131
-
132
-
133
-
134
-
135
-
136
-
137
-
138
-
139
-
140
-
141
-
142
-
143
-
144
-
145
-
146
-
147
-
148
-
149
-
150
-
151
-
152
-
153
-
154
-
155
-
156
-
157
-
158
-
159
-
160
 |
 |
55
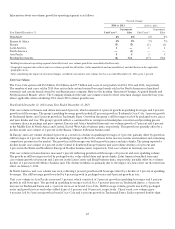
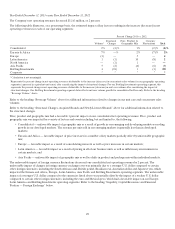
The Corporate segment’s operating loss for the years ended December 31, 2014 and 2013 was $1,448 million and $1,651 million,
respectively. Operating loss in 2013 was unfavorably impacted by a $195 million charge due to the impairment of certain intangible
assets.
Year Ended December 31, 2013 versus Year Ended December 31, 2012
In 2013, foreign currency exchange rates unfavorably impacted consolidated operating income by 4 percent. The unfavorable impact
of changes in foreign currency exchange rates was primarily due to a stronger U.S. dollar compared to certain other foreign currencies,
including the South African rand, British pound, Brazilian real, Australian dollar and Japanese yen, which impacted the Eurasia and
Africa, Europe, Latin America, Asia Pacific and Bottling Investments operating segments. The unfavorable impact of a stronger U.S.
dollar compared to the currencies listed above was partially offset by the impact of a weaker U.S. dollar compared to certain other
foreign currencies, including the euro and Mexican peso, which had a favorable impact on our Europe, Latin America and Bottling
Investments operating segments. Refer to the heading “Liquidity, Capital Resources and Financial Position — Foreign Exchange”
below.
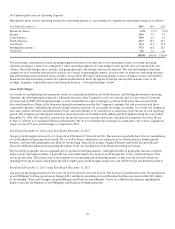
Operating income for Eurasia and Africa for the years ended December 31, 2013 and 2012 was $1,087 million and $1,078 million,
respectively. In 2013, operating income was unfavorably impacted by fluctuations in foreign currency exchange rates by 8 percent. The
segment’s operating income was also favorably impacted by volume and revenue growth during 2013, partially offset by continued
investments in our brands and increased operating expenses.
Europe’s operating income for the years ended December 31, 2013 and 2012 was $2,859 million and $2,960 million, respectively. In
2013, operating income was minimally impacted by fluctuations in foreign currency exchange rates. Operating margin was unfavorably
impacted by higher cost of goods sold and higher operating expenses due to the consolidation of the innocent branded juice and
smoothie business. Generally, bottling and finished product operations have higher net operating revenues but lower operating
margins when compared to concentrate and syrup operations. During 2013, operating income was reduced by $57 million due to
charges related to the Company’s productivity and reinvestment program.
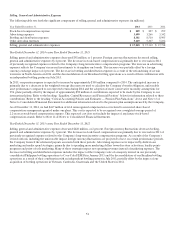
Operating income in Latin America for the years ended December 31, 2013 and 2012 was $2,908 million and $2,879 million,
respectively. In 2013, operating income was unfavorably impacted by fluctuations in foreign currency exchange rates by 10 percent.
Operating income for the segment was also impacted by favorable pricing across all of the business units and volume growth in the
Latin Center and South Latin business units, partially offset by continued investments in the brands, including investments related to
the 2014 FIFA World Cup™.
North America’s operating income for the years ended December 31, 2013 and 2012 was $2,432 million and $2,597 million,
respectively. In both 2013 and 2012, operating income was minimally impacted by fluctuations in foreign currency exchange rates.
The decrease in operating income and operating margin was primarily due to unfavorable product and package mix. North America’s
operating income was also reduced by $282 million due to charges related to the Company’s productivity and reinvestment program, as
compared to $227 million of similar charges in 2012.
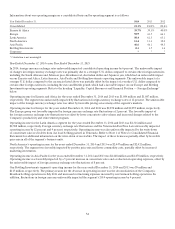
Operating income in Asia Pacific for the years ended December 31, 2013 and 2012 was $2,478 million and $2,516 million, respectively.
In 2013, the segment’s operating income was unfavorably impacted by fluctuations in foreign currency exchange rates by 2 percent and
charges of $25 million related to the Company’s productivity and reinvestment program as well as other restructuring initiatives, as
compared to $2 million of similar charges in 2012.
Our Bottling Investments segment’s operating income for the years ended December 31, 2013 and 2012 was $115 million and
$140 million, respectively. In 2013, operating income was unfavorably impacted by fluctuations in foreign currency exchange rates
by 8 percent. Operating income was also reduced due to the deconsolidation of our Philippine and Brazilian bottling operations. Refer
to Note 2 of Notes to Consolidated Financial Statements. In addition, operating income in 2013 was reduced by $194 million due to
charges related to the Company’s productivity and reinvestment program as well as other restructuring initiatives, as compared to
$164 million of related charges in 2012.
The Corporate segment’s operating loss for the years ended December 31, 2013 and 2012 was $1,651 million and $1,391 million,
respectively. Operating loss in 2013 included impairment charges of $195 million recorded on certain of the Company’s intangible
assets. Operating loss also included charges of $120 million related to the Company’s productivity and reinvestment program as well as
other restructuring initiatives, as compared to similar charges of $33 million in 2012. Operating loss in 2013 was favorably impacted by
fluctuations in foreign currency exchange rates by 2 percent.