Coca Cola 2014 Annual Report Download - page 40
Download and view the complete annual report
Please find page 40 of the 2014 Coca Cola annual report below. You can navigate through the pages in the report by either clicking on the pages listed below, or by using the keyword search tool below to find specific information within the annual report.-
 1
1 -
2
-
3
-
4
-
5
-
6
-
7
-
8
-
9
-
10
-
11
-
12
-
13
-
14
-
15
-
16
-
17
-
18
-
19
-
20
-
21
-
22
-
23
-
24
-
25
-
26
-
27
-
28
-
29
-
 30
30 -
 31
31 -
 32
32 -
 33
33 -
 34
34 -
 35
35 -
 36
36 -
 37
37 -
 38
38 -
 39
39 -
 40
40 -
 41
41 -
 42
42 -
 43
43 -
 44
44 -
 45
45 -
 46
46 -
 47
47 -
 48
48 -
 49
49 -
 50
50 -
51
-
52
-
53
-
54
-
55
-
56
-
57
-
58
-
59
-
60
-
61
-
62
-
63
-
64
-
65
-
66
-
67
-
68
-
69
-
70
-
71
-
72
-
73
-
74
-
75
-
76
-
77
-
78
-
79
-
80
-
81
-
82
-
83
-
84
-
85
-
86
-
87
-
88
-
89
-
90
-
91
-
92
-
93
-
94
-
95
-
96
-
97
-
98
-
99
-
100
-
101
-
102
-
103
-
104
-
105
-
106
-
107
-
108
-
109
-
110
-
111
-
112
-
113
-
114
-
115
-
116
-
117
-
118
-
119
-
120
-
121
-
122
-
123
-
124
-
125
-
126
-
127
-
128
-
129
-
130
-
131
-
132
-
133
-
134
-
135
-
136
-
137
-
138
-
139
-
140
-
141
-
142
-
143
-
144
-
145
-
146
-
147
-
148
-
149
-
150
-
151
-
152
-
153
-
154
-
155
-
156
-
157
-
158
-
159
-
160
 |
 |

38
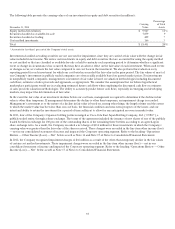
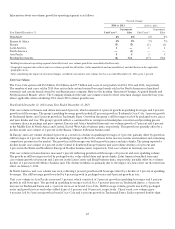
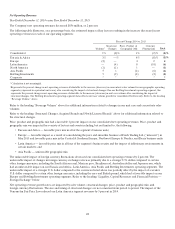
The following table presents the difference between calculated fair values, based on quoted closing prices of publicly traded shares,
and our Company’s cost basis in publicly traded bottlers accounted for as equity method investments (in millions):
December 31, 2014
F
air
V
alue
Carrying
V
alue
Difference
Coca-Cola FEMSA, S.A.B. de
C.
V
.
$
5,012
$ 2,150 $ 2,862
Coca-Cola Amatil
Limited
1,699 761 938
Coca-Cola HBC
A
G
1,639 1,367 272
Coca-Cola ˙
I¸cecek
A.
S
¸
. 1,159
253 906
Coca-Cola East Japan Bottling Company,
Ltd.
618 447 171
Embotelladora Andina
S.A.
373 311 62
Corporación Lindley S.A.
221 108
113
Coca-Cola Bottling Co.
Consolidated
219 100 119
Total
$ 10,940 $ 5,497 $ 5,443
Other Assets
Our Company invests in infrastructure programs with our bottlers that are directed at strengthening our bottling system and increasing
unit case volume. Additionally, our Company advances payments to certain customers for distribution rights as well as to fund future
marketing activities intended to generate profitable volume and expenses such payments over the periods benefited. Payments
under these programs are generally capitalized and reported in the line items prepaid expenses and other assets or other assets, as
appropriate, in our consolidated balance sheets. When facts and circumstances indicate that the carrying value of these assets (or
asset groups) may not be recoverable, management assesses the recoverability of the carrying value by preparing estimates of sales
volume and the resulting gross profit and cash flows. These estimated future cash flows are consistent with those we use in our internal
planning. If the sum of the expected future cash flows (undiscounted and without interest charges) is less than the carrying amount, we
recognize an impairment loss. The impairment loss recognized is the amount by which the carrying amount exceeds the fair value.
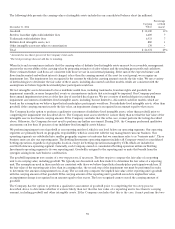
Property, Plant and Equipment
As of December 31, 2014, the carrying value of our property, plant and equipment, net of depreciation, was $14,633 million, or
16 percent of our total assets. Certain events or changes in circumstances may indicate that the recoverability of the carrying amount
or remaining useful life of property, plant and equipment should be assessed, including, among others, the manner or length of time
in which the Company intends to use the asset, a significant decrease in market value, a significant change in the business climate in a
particular market, or a current period operating or cash flow loss combined with historical losses or projected future losses. When such
events or changes in circumstances are present and an impairment review is performed, we estimate the future cash flows expected
to result from the use of the asset (or asset group) and its eventual disposition. These estimated future cash flows are consistent with
those we use in our internal planning. If the sum of the expected future cash flows (undiscounted and without interest charges) is
less than the carrying amount, we recognize an impairment loss. The impairment loss recognized is the amount by which the carrying
amount exceeds the fair value. We use a variety of methodologies to determine the fair value of property, plant and equipment,
including appraisals and discounted cash flow models, which are consistent with the assumptions we believe hypothetical marketplace
participants would use.
Goodwill, Trademarks and Other Intangible Assets
Intangible assets are classified into one of three categories: (1) intangible assets with definite lives subject to amortization,
(2) intangible assets with indefinite lives not subject to amortization and (3) goodwill. For intangible assets with definite lives, tests for
impairment must be performed if conditions exist that indicate the carrying value may not be recoverable. For intangible assets with
indefinite lives and goodwill, tests for impairment must be performed at least annually or more frequently if events or circumstances
indicate that assets might be impaired.