Coca Cola 2014 Annual Report Download - page 141
Download and view the complete annual report
Please find page 141 of the 2014 Coca Cola annual report below. You can navigate through the pages in the report by either clicking on the pages listed below, or by using the keyword search tool below to find specific information within the annual report.-
 1
1 -
2
-
3
-
4
-
5
-
6
-
7
-
8
-
9
-
10
-
11
-
12
-
13
-
14
-
15
-
16
-
17
-
18
-
19
-
20
-
21
-
22
-
23
-
24
-
25
-
26
-
27
-
28
-
29
-
30
-
31
-
32
-
33
-
34
-
35
-
36
-
37
-
38
-
39
-
40
-
41
-
42
-
43
-
44
-
45
-
46
-
47
-
48
-
49
-
50
-
51
-
52
-
53
-
54
-
55
-
56
-
57
-
58
-
59
-
60
-
61
-
62
-
63
-
64
-
65
-
66
-
67
-
68
-
69
-
70
-
71
-
72
-
73
-
74
-
75
-
76
-
77
-
78
-
79
-
80
-
81
-
82
-
83
-
84
-
85
-
86
-
87
-
88
-
89
-
90
-
91
-
92
-
93
-
94
-
95
-
96
-
97
-
98
-
99
-
100
-
101
-
102
-
103
-
104
-
105
-
106
-
107
-
108
-
109
-
110
-
111
-
112
-
113
-
114
-
115
-
116
-
117
-
118
-
119
-
120
-
121
-
122
-
123
-
124
-
125
-
126
-
127
-
128
-
129
-
130
-
 131
131 -
 132
132 -
 133
133 -
 134
134 -
 135
135 -
 136
136 -
 137
137 -
 138
138 -
 139
139 -
 140
140 -
 141
141 -
 142
142 -
 143
143 -
 144
144 -
 145
145 -
 146
146 -
 147
147 -
 148
148 -
 149
149 -
 150
150 -
 151
151 -
152
-
153
-
154
-
155
-
156
-
157
-
158
-
159
-
160
 |
 |

139
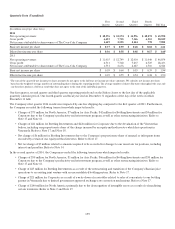
Quarterly Data (Unaudited)
First
Quarter
Second
Quarter
Third
Quarter
Fourth
Quarter Full Year
(In millions except per share d
ata)
2
014
Net operating revenues $ 10,576 $ 12,574 $ 11,976 $ 10,872 $ 45,998
Gross profit 6,493 7,755 7,346 6,515 28,109
Net income attributable to shareowners of The Coca-Cola Company 1,619 2,595 2,114 770 7,098
Basic net income per share $ 0.37 $ 0.59 $ 0.48 $ 0.18 $ 1.62
Diluted net income per share $ 0.36 $ 0.58 $ 0.48 $ 0.17 $ 1.601
2013
Net operating revenues $ 11,035 $ 12,749 $ 12,030 $ 11,040 $ 46,854
Gross profit 6,711 7,760 7,237 6,725 28,433
Net income attributable to shareowners of The Coca-Cola Company 1,751 2,676 2,447 1,710 8,584
Basic net income per share $ 0.39 $ 0.60 $ 0.55 $ 0.39 $ 1.941
Diluted net income per share $ 0.39 $ 0.59 $ 0.54 $ 0.38 $ 1.90
1
The sum of the quarterly net income per share amounts do not agree to the full year net income per share amounts. We calculate net income per share
based on the weighted-average number of outstanding shares during the reporting period. The average number of shares fluctuates throughout the year and
can therefore produce a full year result that does not agree to the sum of the individual quarters.
Our first quarter, second quarter and third quarter reporting periods end on the Friday closest to the last day of the applicable
quarterly calendar period. Our fourth quarter and fiscal year end on December 31 regardless of the day of the week on which
December 31 falls.
The Company’s first quarter 2014 results were impacted by one less shipping day compared to the first quarter of 2013. Furthermore,
the Company recorded the following transactions which impacted results:
• Charges of $75 million for North America, $7 million for Asia Pacific, $42 million for Bottling Investments and $4 million for
Corporate due to the Company’s productivity and reinvestment program as well as other restructuring initiatives. Refer to
Note 17 and Note 18.
• Charges of $21 million for Bottling Investments and $226 million for Corporate due to the devaluation of the Venezuelan
bolivar, including our proportionate share of the charge incurred by an equity method investee which has operations in
Venezuela. Refer to Note 17 and Note 18.
• Net charge of $6 million for Bottling Investments due to the Company’s proportionate share of unusual or infrequent items
recorded by certain of our equity method investees. Refer to Note 17.
• Net tax charge of $5 million related to amounts required to be recorded for changes to our uncertain tax positions, including
interest and penalties. Refer to Note 14.
In the second quarter of 2014, the Company recorded the following transactions which impacted results:
• Charges of $58 million for North America, $1 million for Asia Pacific, $66 million for Bottling Investments and $30 million for
Corporate due to the Company’s productivity and reinvestment program as well as other restructuring initiatives. Refer to
Note 17 and Note 18.
• Charge of $25 million for Bottling Investments as a result of the restructuring and transition of the Company’s Russian juice
operations to an existing joint venture with an unconsolidated bottling partner. Refer to Note 17.
• Charge of $21 million for Corporate as a result of a write-down of receivables related to sales of concentrate to our bottling
partner in Venezuela due to limited government-approved exchange rate conversion mechanisms. Refer to Note 17.
• Charge of $140 million for North America primarily due to the derecognition of intangible assets as a result of refranchising
certain territories. Refer to Note 2 and Note 17.