Coca Cola 2014 Annual Report Download - page 115
Download and view the complete annual report
Please find page 115 of the 2014 Coca Cola annual report below. You can navigate through the pages in the report by either clicking on the pages listed below, or by using the keyword search tool below to find specific information within the annual report.-
 1
1 -
2
-
3
-
4
-
5
-
6
-
7
-
8
-
9
-
10
-
11
-
12
-
13
-
14
-
15
-
16
-
17
-
18
-
19
-
20
-
21
-
22
-
23
-
24
-
25
-
26
-
27
-
28
-
29
-
30
-
31
-
32
-
33
-
34
-
35
-
36
-
37
-
38
-
39
-
40
-
41
-
42
-
43
-
44
-
45
-
46
-
47
-
48
-
49
-
50
-
51
-
52
-
53
-
54
-
55
-
56
-
57
-
58
-
59
-
60
-
61
-
62
-
63
-
64
-
65
-
66
-
67
-
68
-
69
-
70
-
71
-
72
-
73
-
74
-
75
-
76
-
77
-
78
-
79
-
80
-
81
-
82
-
83
-
84
-
85
-
86
-
87
-
88
-
89
-
90
-
91
-
92
-
93
-
94
-
95
-
96
-
97
-
98
-
99
-
100
-
101
-
102
-
103
-
104
-
 105
105 -
 106
106 -
 107
107 -
 108
108 -
 109
109 -
 110
110 -
 111
111 -
 112
112 -
 113
113 -
 114
114 -
 115
115 -
 116
116 -
 117
117 -
 118
118 -
 119
119 -
 120
120 -
 121
121 -
 122
122 -
 123
123 -
 124
124 -
 125
125 -
126
-
127
-
128
-
129
-
130
-
131
-
132
-
133
-
134
-
135
-
136
-
137
-
138
-
139
-
140
-
141
-
142
-
143
-
144
-
145
-
146
-
147
-
148
-
149
-
150
-
151
-
152
-
153
-
154
-
155
-
156
-
157
-
158
-
159
-
160
 |
 |

113
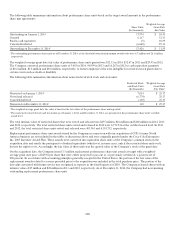
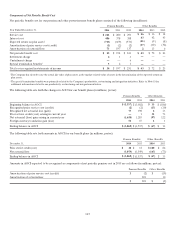
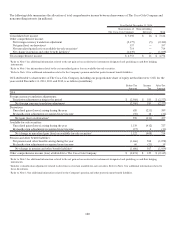
Components of Net Periodic Benefit Cost
Net periodic benefit cost for our pension and other postretirement benefit plans consisted of the following (in millions):
Pension Benefits Other Benefits
Year Ended December 31, 2014 2013 2012 2014 2013 2012
Service cost $ 261 $ 280 $ 291 $ 26 $ 36 $ 34
Interest cost 406 378 388 43 42 43
Expected return on plan assets1(713) (659) (573) (11 ) (9 ) (8)
Amortization of prior service cost (credit) (2) (2) (2) (17 ) (10) (52)
Amortization of actuarial loss
73 197 137 213 6
Net periodic benefit cost $ 25 $ 194 $ 241 $ 43 $ 72 $ 23
Settlement charge 41 3 —— —
Curtailment charge
—— 6 —— —
Special termination benefits
2
52 1 —— —
Total cost recognized in statements of income $ 34 $ 197 $ 251 $ 43 $ 72 $ 23
1 The Company has elected to use the actual fair value of plan assets as the market-related value of assets in the determination of the expected return on
plan assets.
2 The special termination benefits were primarily related to the Company’s productivity, restructuring and integration initiatives. Refer to Note 18 for
additional information related to our productivity, restructuring and integration initiatives.
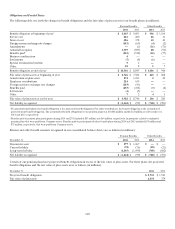
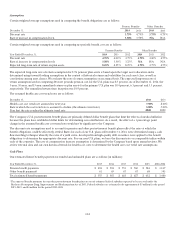
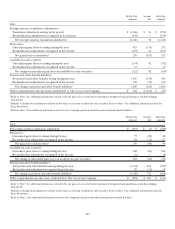
The following table sets forth the changes in AOCI for our benefit plans (in millions, pretax):
P
ension Benefits Other Benefits
2014 2013 2014 2013
Beginning balance in AOCI
$ (1,537
) $ (3,032)
$ 13
$ (186)
Recognized prior service cost (credit)
(2) (2) (17) (10)
Recognized net actuarial loss (gain)
77 198 213
Prior service credit (cost) arising in current year
—131 73
Net actuarial (loss) gain arising in current year
(1,658) 1,283 (97) 122
Foreign currency translation gain (loss) 51 15 11
Ending balance in AOCI
$ (3,069
) $ (1,537) $ (67) $ 13
The following table sets forth amounts in AOCI for our benefit plans (in millions, pretax):
Pension
B
enefits Other
B
enefits
December 31, 2014 2013 2014 2013
Prior service credit (cost) $ 10 $ 12 $ 100 $ 86
Net actuarial loss (3,079) (1,549) (167) (73)
Ending balance in AOCI
$ (3,069
) $ (1,537) $ (67) $ 13
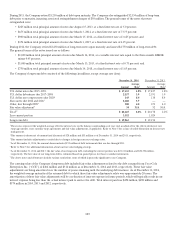
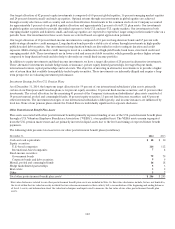
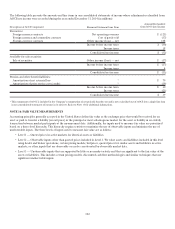
Amounts in AOCI expected to be recognized as components of net periodic pension cost in 2015 are as follows (in millions, pretax):
Pension
Benefits
Other
Benefits
Amortization of prior service cost (credit)
$ (2) $ (19)
Amortization of actuarial loss 203 10
$ 201 $ (9)