Coca Cola 2014 Annual Report Download - page 132
Download and view the complete annual report
Please find page 132 of the 2014 Coca Cola annual report below. You can navigate through the pages in the report by either clicking on the pages listed below, or by using the keyword search tool below to find specific information within the annual report.-
 1
1 -
2
-
3
-
4
-
5
-
6
-
7
-
8
-
9
-
10
-
11
-
12
-
13
-
14
-
15
-
16
-
17
-
18
-
19
-
20
-
21
-
22
-
23
-
24
-
25
-
26
-
27
-
28
-
29
-
30
-
31
-
32
-
33
-
34
-
35
-
36
-
37
-
38
-
39
-
40
-
41
-
42
-
43
-
44
-
45
-
46
-
47
-
48
-
49
-
50
-
51
-
52
-
53
-
54
-
55
-
56
-
57
-
58
-
59
-
60
-
61
-
62
-
63
-
64
-
65
-
66
-
67
-
68
-
69
-
70
-
71
-
72
-
73
-
74
-
75
-
76
-
77
-
78
-
79
-
80
-
81
-
82
-
83
-
84
-
85
-
86
-
87
-
88
-
89
-
90
-
91
-
92
-
93
-
94
-
95
-
96
-
97
-
98
-
99
-
100
-
101
-
102
-
103
-
104
-
105
-
106
-
107
-
108
-
109
-
110
-
111
-
112
-
113
-
114
-
115
-
116
-
117
-
118
-
119
-
120
-
121
-
 122
122 -
 123
123 -
 124
124 -
 125
125 -
 126
126 -
 127
127 -
 128
128 -
 129
129 -
 130
130 -
 131
131 -
 132
132 -
 133
133 -
 134
134 -
 135
135 -
 136
136 -
 137
137 -
 138
138 -
 139
139 -
 140
140 -
 141
141 -
 142
142 -
143
-
144
-
145
-
146
-
147
-
148
-
149
-
150
-
151
-
152
-
153
-
154
-
155
-
156
-
157
-
158
-
159
-
160
 |
 |

130
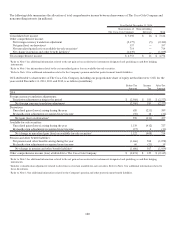
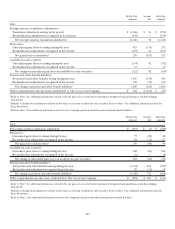
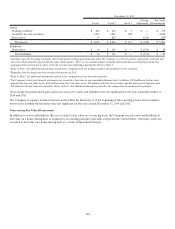
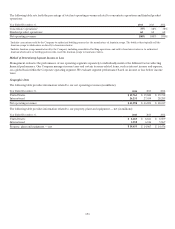
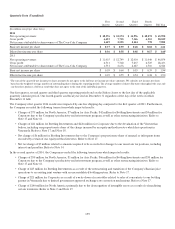
The following table summarizes the balance of accrued expenses related to these productivity and reinvestment initiatives and the
changes in the accrued amounts since the commencement of the plan (in millions):
Severance Pay
and Benefits
Outside
Services
Other
Direct Costs
Total
2012
Costs incurred $ 21 $ 61 $ 188 $ 270
Payments (8) (55) (167) (230 )
Noncash and exchange (1) — (13) (14)
Accrued balance as of December 31 $ 12 $ 6 $ 8 $ 26
2013
Costs incurred $ 188 $ 59 $ 247 $ 494
Payments (113) (59) (209) (381)
Noncash and exchange 1 — (28) (27)
Accrued balance as of December 31 $ 88 $ 6 $ 18 $ 112
2014
Costs incurred $ 277 $ 77 $ 247 $ 601
Payments (103)(79)(220)(402)
Noncash and exchange (2) — (24)(26)
Accrued balance as of December 31 $ 260 $ 4 $ 21 $ 285
Integration Initiatives
Integration of Our German Bottling and Distribution Operations
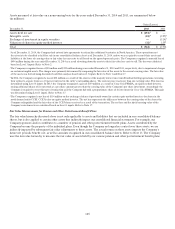
In 2008, the Company began an integration initiative related to the 18 German bottling and distribution operations acquired in 2007.
The Company incurred $208 million, $187 million and $148 million of expenses related to this initiative in 2014, 2013 and 2012,
respectively, and has incurred total pretax expenses of $835 million related to this initiative since it commenced. These expenses were
recorded in the line item other operating charges in our consolidated statements of income and impacted the Bottling Investments
operating segment. The expenses recorded in connection with these integration activities have been primarily due to involuntary
terminations. The Company had $101 million and $127 million accrued related to these integration costs as of December 31, 2014 and
2013, respectively.
The Company is currently reviewing other restructuring opportunities within the German bottling and distribution operations, which if
implemented will result in additional charges in future periods. However, as of December 31, 2014, the Company had not finalized any
additional plans.
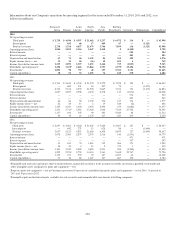
NOTE 19: OPERATING SEGMENTS
As of December 31, 2014, our organizational structure consisted of the following operating segments: Eurasia and Africa; Europe;
Latin America; North America; Asia Pacific; Bottling Investments; and Corporate.
Segment Products and Services
The business of our Company is nonalcoholic beverages. With the exception of North America, our geographic operating segments
(Eurasia and Africa; Europe; Latin America; North America; and Asia Pacific) derive a majority of their revenues from the
manufacture and sale of beverage concentrates and syrups and, in some cases, the sale of finished beverages. The North America
operating segment derives the majority of its revenues from the sale of finished beverages. Our Bottling Investments operating
segment is composed of our Company-owned or consolidated bottling operations outside of North America, regardless of the
geographic location of the bottler, and equity income from the majority of our equity method investments. Company-owned or
consolidated bottling operations derive the majority of their revenues from the sale of finished beverages. Generally, bottling and
finished product operations produce higher net revenues but lower gross profit margins compared to concentrate and syrup operations.