Coca Cola 2014 Annual Report Download - page 93
Download and view the complete annual report
Please find page 93 of the 2014 Coca Cola annual report below. You can navigate through the pages in the report by either clicking on the pages listed below, or by using the keyword search tool below to find specific information within the annual report.-
 1
1 -
2
-
3
-
4
-
5
-
6
-
7
-
8
-
9
-
10
-
11
-
12
-
13
-
14
-
15
-
16
-
17
-
18
-
19
-
20
-
21
-
22
-
23
-
24
-
25
-
26
-
27
-
28
-
29
-
30
-
31
-
32
-
33
-
34
-
35
-
36
-
37
-
38
-
39
-
40
-
41
-
42
-
43
-
44
-
45
-
46
-
47
-
48
-
49
-
50
-
51
-
52
-
53
-
54
-
55
-
56
-
57
-
58
-
59
-
60
-
61
-
62
-
63
-
64
-
65
-
66
-
67
-
68
-
69
-
70
-
71
-
72
-
73
-
74
-
75
-
76
-
77
-
78
-
79
-
80
-
81
-
82
-
 83
83 -
 84
84 -
 85
85 -
 86
86 -
 87
87 -
 88
88 -
 89
89 -
 90
90 -
 91
91 -
 92
92 -
 93
93 -
 94
94 -
 95
95 -
 96
96 -
 97
97 -
 98
98 -
 99
99 -
 100
100 -
 101
101 -
 102
102 -
 103
103 -
104
-
105
-
106
-
107
-
108
-
109
-
110
-
111
-
112
-
113
-
114
-
115
-
116
-
117
-
118
-
119
-
120
-
121
-
122
-
123
-
124
-
125
-
126
-
127
-
128
-
129
-
130
-
131
-
132
-
133
-
134
-
135
-
136
-
137
-
138
-
139
-
140
-
141
-
142
-
143
-
144
-
145
-
146
-
147
-
148
-
149
-
150
-
151
-
152
-
153
-
154
-
155
-
156
-
157
-
158
-
159
-
160
 |
 |
91
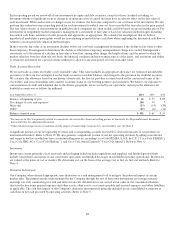
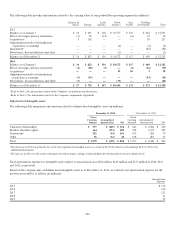
Available-for-Sale and Held-to-Maturity Securities
As of December 31, 2014 and 2013, the Company did not have any held-to-maturity securities. Available-for-sale securities consisted
of the following (in millions):
Gross
Unrealized
Cost Gains Losses
Est
imated
Fair Value
2014
Available-for-sale securities:1
Equity securities $ 2,687 $ 1,463 $ (29) $ 4,121
Debt securities 3,796 68 (106)23,758
$ 6,483 $ 1,531 $ (135) $ 7,879
2013
Available-for-sale securities:1
Equity securities
$ 1,097 $ 373 $ (17) $ 1,453
Debt securities
3,388 24 (23) 3,389
$ 4,485 $ 397 $ (40) $ 4,842
1 Refer to Note 16 for additional information related to the estimated fair value.
2 Includes $101 million recognized in the consolidated income statement line item other income (loss) — net during the year ended December 31, 2014.
The amount was primarily offset by changes in the fair value of foreign currency contracts designated as fair value hedges. Refer to Note 5 for additional
information.
The sale and/or maturity of available-for-sale securities resulted in the following activity (in millions):
Year Ended December 31, 2014 2013 2012
Gross gains $ 38 $ 12 $ 41
Gross losses (21) (24) (35)
Proceeds
4,157 4,212 5,036
In 2014 and 2013, the Company had investments classified as available-for-sale securities in which our cost basis exceeded the fair
value of our investment. Management assessed each of these investments on an individual basis to determine if the decline in fair
value was other than temporary. Management’s assessment as to the nature of a decline in fair value is based on, among other things,
the length of time and the extent to which the market value has been less than our cost basis; the financial condition and near-term
prospects of the issuer; and our intent and ability to retain the investment for a period of time sufficient to allow for any anticipated
recovery in market value. As a result of these assessments, management determined that the decline in fair value of these investments
was not other than temporary and did not record any impairment charges.
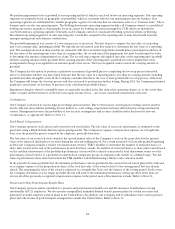
The Company uses insurance captives to reinsure group annuity insurance contracts that cover the pension obligations of certain of
our European and Canadian pension plans. In accordance with local insurance regulations, our insurance captive is required to meet
and maintain minimum solvency capital requirements. The Company elected to invest its solvency capital in a portfolio of available-
for-sale securities, which have been classified in the line item other assets in our consolidated balance sheets because the assets are
not available to satisfy our current obligations. As of December 31, 2014, and December 31, 2013, the Company’s available-for-sale
securities included solvency capital funds of $836 million and $667 million, respectively.
In 2014 and 2013, the Company did not have any held-to-maturity securities. The Company’s available-for-sale securities were
included in the following line items in our consolidated balance sheets (in millions):
December 31, 2014 2013
Cash and cash equivalents
$ 43 $ 245
Marketable securities
3,350 2,861
Other investments
3,512 958
Other assets 974 778
$ 7,879 $ 4,842