Coca Cola 2014 Annual Report Download - page 127
Download and view the complete annual report
Please find page 127 of the 2014 Coca Cola annual report below. You can navigate through the pages in the report by either clicking on the pages listed below, or by using the keyword search tool below to find specific information within the annual report.-
 1
1 -
2
-
3
-
4
-
5
-
6
-
7
-
8
-
9
-
10
-
11
-
12
-
13
-
14
-
15
-
16
-
17
-
18
-
19
-
20
-
21
-
22
-
23
-
24
-
25
-
26
-
27
-
28
-
29
-
30
-
31
-
32
-
33
-
34
-
35
-
36
-
37
-
38
-
39
-
40
-
41
-
42
-
43
-
44
-
45
-
46
-
47
-
48
-
49
-
50
-
51
-
52
-
53
-
54
-
55
-
56
-
57
-
58
-
59
-
60
-
61
-
62
-
63
-
64
-
65
-
66
-
67
-
68
-
69
-
70
-
71
-
72
-
73
-
74
-
75
-
76
-
77
-
78
-
79
-
80
-
81
-
82
-
83
-
84
-
85
-
86
-
87
-
88
-
89
-
90
-
91
-
92
-
93
-
94
-
95
-
96
-
97
-
98
-
99
-
100
-
101
-
102
-
103
-
104
-
105
-
106
-
107
-
108
-
109
-
110
-
111
-
112
-
113
-
114
-
115
-
116
-
 117
117 -
 118
118 -
 119
119 -
 120
120 -
 121
121 -
 122
122 -
 123
123 -
 124
124 -
 125
125 -
 126
126 -
 127
127 -
 128
128 -
 129
129 -
 130
130 -
 131
131 -
 132
132 -
 133
133 -
 134
134 -
 135
135 -
 136
136 -
 137
137 -
138
-
139
-
140
-
141
-
142
-
143
-
144
-
145
-
146
-
147
-
148
-
149
-
150
-
151
-
152
-
153
-
154
-
155
-
156
-
157
-
158
-
159
-
160
 |
 |

125
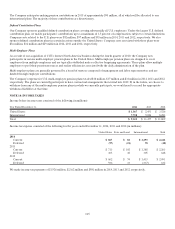
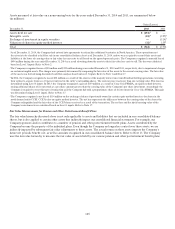
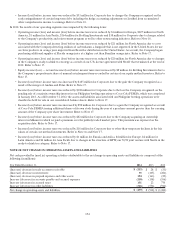
Assets measured at fair value on a nonrecurring basis for the years ended December 31, 2014 and 2013, are summarized below
(in millions):
Gains (Losses)
December 31, 2014 2013
Assets held for sale
$
(494)
1
$ —
Intangible assets
(18)
2
(195)2
Exchange of investment in equity securities
—(114)4
Valuation of shares in equity method investee
(32)3139
3
T
otal
$
(544)
$ (170)
1
As of December 31, 2014, the Company had entered into agreements to refranchise additional territories in North America. These operations met
the criteria to be classified as held for sale in our consolidated balance sheet as of December 31, 2014, and we were required to record their assets and
liabilities at the lower of carrying value or fair value less any costs to sell based on the agreed-upon sale price. The Company recognized a noncash loss of
$494 million during the year ended December 31, 2014 as a result of writing down the assets to their fair value less costs to sell. The loss was calculated
based on Level 3 inputs. Refer to Note 2.
2 The Company recognized losses of $18 million and $195 million during years ended December 31, 2014 and 2013, respectively, due to impairment charges
on certain intangible assets. The charges were primarily determined by comparing the fair value of the assets to the current carrying value. The fair value
of the assets was derived using discounted cash flow analyses based on Level 3 inputs. Refer to Note 1 and Note 17.
3 In 2014, the Company recognized a loss of $32 million as a result of the owners of the majority interest in certain Brazilian bottling operations exercising
their option to acquire from us a 10 percent interest in the entity’s outstanding shares. The exercise price was lower than our carrying value. This loss was
determined using Level 3 inputs. In 2013, the Company recognized a gain of $139 million as a result of Coca-Cola FEMSA, an equity method investee,
issuing additional shares of its own stock at a per share amount greater than the carrying value of the Company’s per share investment. Accordingly, the
Company is required to treat this type of transaction as if the Company had sold a proportionate share of its investment in Coca-Cola FEMSA. This gain
was determined using Level 1 inputs. Refer to Note 17.
4
The Company recognized a net loss of $114 million on the exchange of shares it previously owned in certain equity method investees for shares in the
newly formed entity CCEJ. CCEJ is also an equity method investee. The net loss represents the difference between the carrying value of the shares the
Company relinquished and the fair value of the CCEJ shares received as a result of the transaction. The net loss and the initial carrying value of the
Company’s investment were calculated based on Level 1 inputs. Refer to Note 17.
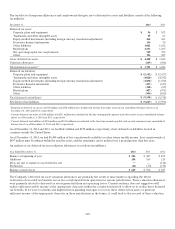
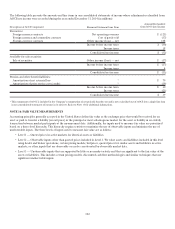
Fair Value Measurements for Pension and Other Postretirement Benefit Plans
The fair value hierarchy discussed above is not only applicable to assets and liabilities that are included in our consolidated balance
sheets, but is also applied to certain other assets that indirectly impact our consolidated financial statements. For example, our
Company sponsors and/or contributes to a number of pension and other postretirement benefit plans. Assets contributed by the
Company become the property of the individual plans. Even though the Company no longer has control over these assets, we are
indirectly impacted by subsequent fair value adjustments to these assets. The actual return on these assets impacts the Company’s
future net periodic benefit cost, as well as amounts recognized in our consolidated balance sheets. Refer to Note 13. The Company
uses the fair value hierarchy to measure the fair value of assets held by our various pension and other postretirement benefit plans.