Coca Cola 2014 Annual Report Download - page 129
Download and view the complete annual report
Please find page 129 of the 2014 Coca Cola annual report below. You can navigate through the pages in the report by either clicking on the pages listed below, or by using the keyword search tool below to find specific information within the annual report.-
 1
1 -
2
-
3
-
4
-
5
-
6
-
7
-
8
-
9
-
10
-
11
-
12
-
13
-
14
-
15
-
16
-
17
-
18
-
19
-
20
-
21
-
22
-
23
-
24
-
25
-
26
-
27
-
28
-
29
-
30
-
31
-
32
-
33
-
34
-
35
-
36
-
37
-
38
-
39
-
40
-
41
-
42
-
43
-
44
-
45
-
46
-
47
-
48
-
49
-
50
-
51
-
52
-
53
-
54
-
55
-
56
-
57
-
58
-
59
-
60
-
61
-
62
-
63
-
64
-
65
-
66
-
67
-
68
-
69
-
70
-
71
-
72
-
73
-
74
-
75
-
76
-
77
-
78
-
79
-
80
-
81
-
82
-
83
-
84
-
85
-
86
-
87
-
88
-
89
-
90
-
91
-
92
-
93
-
94
-
95
-
96
-
97
-
98
-
99
-
100
-
101
-
102
-
103
-
104
-
105
-
106
-
107
-
108
-
109
-
110
-
111
-
112
-
113
-
114
-
115
-
116
-
117
-
118
-
 119
119 -
 120
120 -
 121
121 -
 122
122 -
 123
123 -
 124
124 -
 125
125 -
 126
126 -
 127
127 -
 128
128 -
 129
129 -
 130
130 -
 131
131 -
 132
132 -
 133
133 -
 134
134 -
 135
135 -
 136
136 -
 137
137 -
 138
138 -
 139
139 -
140
-
141
-
142
-
143
-
144
-
145
-
146
-
147
-
148
-
149
-
150
-
151
-
152
-
153
-
154
-
155
-
156
-
157
-
158
-
159
-
160
 |
 |

127
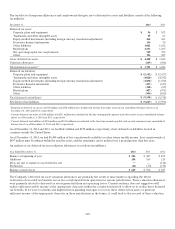
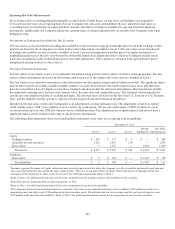
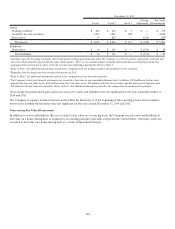
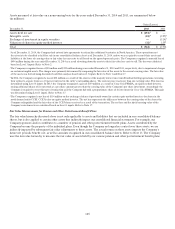
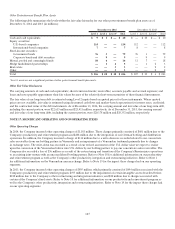
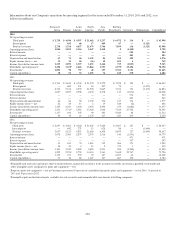
Other Postretirement Benefit Plan Assets
The following table summarizes the levels within the fair value hierarchy for our other postretirement benefit plan assets as of
December 31, 2014 and 2013 (in millions):
December 31, 2014 December 31, 2013
Level 1 Level 2 Level 31Total Level 1 Level 2 Level 31Total
Cash and cash
equivalents
$ 9 $ 1 $ — $ 10 $ — $ 10 $ — $ 10
Equity
securities:
U.S.-based
companies
114 — — 114 112 — — 112
International-based
companies
7 — — 7 8 — — 8
Fixed-income
securities:
Government bonds 76 3 — 79 76 3 — 79
Corporate bonds and debt
securities
— 9 — 9 — 9 — 9
Mutual, pooled and commingled funds 10 6 — 16 11 7 — 18
Hedge funds/limited
partnerships
— 1 4 5 —123
Real
estate
— — 3 3 — — 2 2
Other — — 3 3 — — 2 2
T
otal
$ 216 $ 20 $ 10 $ 246 $ 207 $ 30 $ 6 $ 243
1
Level 3 assets are not a significant portion of other postretirement benefit plan assets.
Other Fair Value Disclosures
The carrying amounts of cash and cash equivalents; short-term investments; receivables; accounts payable and accrued expenses; and
loans and notes payable approximate their fair values because of the relatively short-term maturities of these financial instruments.
The fair value of our long-term debt is estimated using Level 2 inputs based on quoted prices for those instruments. Where quoted
prices are not available, fair value is estimated using discounted cash flows and market-based expectations for interest rates, credit risk
and the contractual terms of the debt instruments. As of December 31, 2014, the carrying amount and fair value of our long-term debt,
including the current portion, were $22,615 million and $23,411 million, respectively. As of December 31, 2013, the carrying amount
and fair value of our long-term debt, including the current portion, were $20,178 million and $20,352 million, respectively.
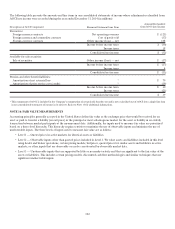
NOTE 17: SIGNIFICANT OPERATING AND NONOPERATING ITEMS
Other Operating Charges
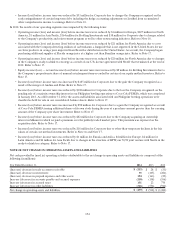
In 2014, the Company incurred other operating charges of $1,183 million. These charges primarily consisted of $601 million due to the
Company’s productivity and reinvestment program and $208 million due to the integration of our German bottling and distribution
operations. In addition, the Company incurred a charge of $314 million due to a write-down we recorded related to our concentrate
sales receivables from our bottling partner in Venezuela and an impairment of a Venezuelan trademark primarily due to changes
in exchange rates. The write-down was recorded as a result of our revised assessment of the U.S. dollar value we expect to realize
upon the conversion of the Venezuelan bolivar into U.S. dollars by our bottling partner to pay our concentrate sales receivables. The
Company also recorded a loss of $36 million as a result of the restructuring and transition of the Company’s Russian juice operations
to an existing joint venture with an unconsolidated bottling partner. Refer to Note 18 for additional information on our productivity
and reinvestment program as well as the Company’s other productivity, integration and restructuring initiatives. Refer to Note 1
for additional information on the Venezuelan currency change. Refer to Note 19 for the impact these charges had on our operating
segments.
In 2013, the Company incurred other operating charges of $895 million, which primarily consisted of $494 million associated with the
Company’s productivity and reinvestment program; $195 million due to the impairment of certain intangible assets described below;
$188 million due to the Company’s other restructuring and integration initiatives; and $22 million due to charges associated with
certain of the Company’s fixed assets. Refer to Note 18 for additional information on our productivity and reinvestment program as
well as the Company’s other productivity, integration and restructuring initiatives. Refer to Note 19 for the impact these charges had
on our operating segments.