Coca Cola 2014 Annual Report Download - page 84
Download and view the complete annual report
Please find page 84 of the 2014 Coca Cola annual report below. You can navigate through the pages in the report by either clicking on the pages listed below, or by using the keyword search tool below to find specific information within the annual report.-
 1
1 -
2
-
3
-
4
-
5
-
6
-
7
-
8
-
9
-
10
-
11
-
12
-
13
-
14
-
15
-
16
-
17
-
18
-
19
-
20
-
21
-
22
-
23
-
24
-
25
-
26
-
27
-
28
-
29
-
30
-
31
-
32
-
33
-
34
-
35
-
36
-
37
-
38
-
39
-
40
-
41
-
42
-
43
-
44
-
45
-
46
-
47
-
48
-
49
-
50
-
51
-
52
-
53
-
54
-
55
-
56
-
57
-
58
-
59
-
60
-
61
-
62
-
63
-
64
-
65
-
66
-
67
-
68
-
69
-
70
-
71
-
72
-
73
-
 74
74 -
 75
75 -
 76
76 -
 77
77 -
 78
78 -
 79
79 -
 80
80 -
 81
81 -
 82
82 -
 83
83 -
 84
84 -
 85
85 -
 86
86 -
 87
87 -
 88
88 -
 89
89 -
 90
90 -
 91
91 -
 92
92 -
 93
93 -
 94
94 -
95
-
96
-
97
-
98
-
99
-
100
-
101
-
102
-
103
-
104
-
105
-
106
-
107
-
108
-
109
-
110
-
111
-
112
-
113
-
114
-
115
-
116
-
117
-
118
-
119
-
120
-
121
-
122
-
123
-
124
-
125
-
126
-
127
-
128
-
129
-
130
-
131
-
132
-
133
-
134
-
135
-
136
-
137
-
138
-
139
-
140
-
141
-
142
-
143
-
144
-
145
-
146
-
147
-
148
-
149
-
150
-
151
-
152
-
153
-
154
-
155
-
156
-
157
-
158
-
159
-
160
 |
 |

82
Each reporting period we review all of our investments in equity and debt securities, except for those classified as trading, to
determine whether a significant event or change in circumstances has occurred that may have an adverse effect on the fair value of
each investment. When such events or changes occur, we evaluate the fair value compared to our cost basis in the investment. We also
perform this evaluation every reporting period for each investment for which our cost basis exceeded the fair value in the prior period.
The fair values of most of our investments in publicly traded companies are often readily available based on quoted market prices. For
investments in nonpublicly traded companies, management’s assessment of fair value is based on valuation methodologies including
discounted cash flows, estimates of sales proceeds and appraisals, as appropriate. We consider the assumptions that we believe
hypothetical marketplace participants would use in evaluating estimated future cash flows when employing the discounted cash flow or
estimates of sales proceeds valuation methodologies.
In the event the fair value of an investment declines below our cost basis, management determines if the decline in fair value is other
than temporary. If management determines the decline is other than temporary, an impairment charge is recorded. Management’s
assessment as to the nature of a decline in fair value is based on, among other things, the length of time and the extent to which the
market value has been less than our cost basis, the financial condition and near-term prospects of the issuer, and our intent and ability
to retain the investment for a period of time sufficient to allow for any anticipated recovery in market value.
Trade Accounts Receivable
We record trade accounts receivable at net realizable value. This value includes an appropriate allowance for estimated uncollectible
accounts to reflect any loss anticipated on the trade accounts receivable balances and charged to the provision for doubtful accounts.
We calculate this allowance based on our history of write-offs, the level of past-due accounts based on the contractual terms of the
receivables, and our relationships with, and the economic status of, our bottling partners and customers. We believe our exposure to
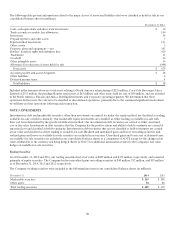
concentrations of credit risk is limited due to the diverse geographic areas covered by our operations. Activity in the allowance for
doubtful accounts was as follows (in millions):
Year Ended December 31, 2014 2013 2012
Balance at beginning of year $ 61 $ 53 $ 83
Net charges to costs and expenses1308 30 5
Write-offs (13) (14) (19)
Other2(25)(8) (16)
Balance at end of year $ 331 $ 61 $ 53
1
The increase in 2014 was primarily related to concentrate sales receivables from our bottling partner in Venezuela. See Hyperinflationary Economies
discussion below for additional information.
2 Other includes foreign currency translation and the impact of transferring certain assets to assets held for sale. See Note 2.
A significant portion of our net operating revenues and corresponding accounts receivable is derived from sales of our products in
international markets. Refer to Note 19. We also generate a significant portion of our net operating revenues by selling concentrates
and syrups to bottlers in which we have a noncontrolling interest, including Coca-Cola FEMSA, S.A.B. de C.V. (“Coca-Cola FEMSA”),
Coca-Cola HBC AG (“Coca-Cola Hellenic”), and Coca-Cola Amatil Limited (“Coca-Cola Amatil”). Refer to Note 6.
Inventories
Inventories consist primarily of raw materials and packaging (which includes ingredients and supplies) and finished goods (which
include concentrates and syrups in our concentrate operations and finished beverages in our finished product operations). Inventories
are valued at the lower of cost or market. We determine cost on the basis of the average cost or first-in, first-out methods. Refer to
Note 4.
Derivative Instruments
Our Company, when deemed appropriate, uses derivatives as a risk management tool to mitigate the potential impact of certain
market risks. The primary market risks managed by the Company through the use of derivative instruments are foreign currency
exchange rate risk, commodity price risk and interest rate risk. All derivatives are carried at fair value in our consolidated balance
sheets in the line items prepaid expenses and other assets; other assets; or accounts payable and accrued expenses; and other liabilities,
as applicable. The cash flow impact of the Company’s derivative instruments is primarily included in our consolidated statements of
cash flows in net cash provided by operating activities. Refer to Note 5.