Coca Cola 2014 Annual Report Download - page 113
Download and view the complete annual report
Please find page 113 of the 2014 Coca Cola annual report below. You can navigate through the pages in the report by either clicking on the pages listed below, or by using the keyword search tool below to find specific information within the annual report.-
 1
1 -
2
-
3
-
4
-
5
-
6
-
7
-
8
-
9
-
10
-
11
-
12
-
13
-
14
-
15
-
16
-
17
-
18
-
19
-
20
-
21
-
22
-
23
-
24
-
25
-
26
-
27
-
28
-
29
-
30
-
31
-
32
-
33
-
34
-
35
-
36
-
37
-
38
-
39
-
40
-
41
-
42
-
43
-
44
-
45
-
46
-
47
-
48
-
49
-
50
-
51
-
52
-
53
-
54
-
55
-
56
-
57
-
58
-
59
-
60
-
61
-
62
-
63
-
64
-
65
-
66
-
67
-
68
-
69
-
70
-
71
-
72
-
73
-
74
-
75
-
76
-
77
-
78
-
79
-
80
-
81
-
82
-
83
-
84
-
85
-
86
-
87
-
88
-
89
-
90
-
91
-
92
-
93
-
94
-
95
-
96
-
97
-
98
-
99
-
100
-
101
-
102
-
 103
103 -
 104
104 -
 105
105 -
 106
106 -
 107
107 -
 108
108 -
 109
109 -
 110
110 -
 111
111 -
 112
112 -
 113
113 -
 114
114 -
 115
115 -
 116
116 -
 117
117 -
 118
118 -
 119
119 -
 120
120 -
 121
121 -
 122
122 -
 123
123 -
124
-
125
-
126
-
127
-
128
-
129
-
130
-
131
-
132
-
133
-
134
-
135
-
136
-
137
-
138
-
139
-
140
-
141
-
142
-
143
-
144
-
145
-
146
-
147
-
148
-
149
-
150
-
151
-
152
-
153
-
154
-
155
-
156
-
157
-
158
-
159
-
160
 |
 |

111
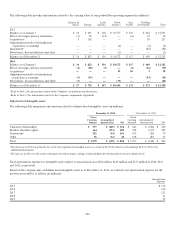
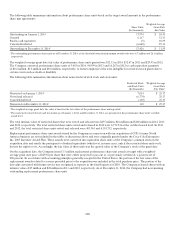
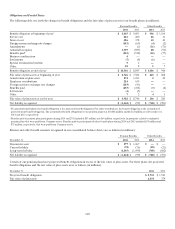
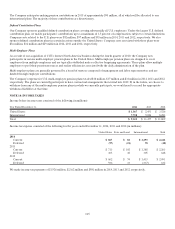
Certain of our pension plans have accumulated benefit obligations in excess of the fair value of plan assets. For these plans, the
accumulated benefit obligations and the fair value of plan assets were as follows (in millions):
December 31, 2014 2013
Accumulated benefit
obligation
$ 8,501 $ 1,446
Fair value of plan assets 6,820 351
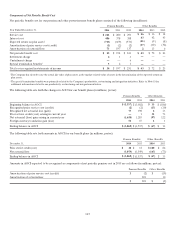
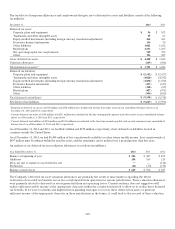
Pension Plan Assets
The following table presents total assets for our U.S. and non-U.S. pension plans (in millions):
U.S. Plans Non-U.S. Plans
December 31, 2014 2013 2014 2013
Cash and cash
equivalents
$ 186 $ 240 $ 75 $ 274
Equity
securities:
U.S.-based
companies
1,274 1,422 542 280
International-based
companies
558 698 505 586
Fixed-income
securities:
Government bonds 455 464 411 304
Corporate bonds and debt
securities
1,379 1,369 187 137
Mutual, pooled and commingled funds1863 1,134 400 453
Hedge funds/limited
partnerships
756 526 43 17
Real
estate
391 245 17 6
Other 481 245 379 346
Total pension plan assets2$ 6,343 $ 6,343 $ 2,559 $ 2,403
1 Mutual, pooled and commingled funds include investments in equity securities, fixed-income securities and combinations of both. There are a significant
number of mutual, pooled and commingled funds from which investors can choose. The selection of the type of fund is dictated by the specific investment
objectives and needs of a given plan. These objectives and needs vary greatly between plans.
2 Fair value disclosures related to our pension assets are included in Note 16. Fair value disclosures include, but are not limited to, the levels within the fair
value hierarchy in which the fair value measurements in their entirety fall; a reconciliation of the beginning and ending balances of Level 3 assets; and
information about the valuation techniques and inputs used to measure the fair value of our pension assets.
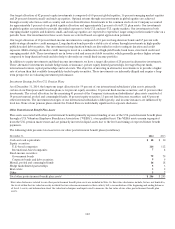
Investment Strategy for U.S. Pension Plans
The Company utilizes the services of investment managers to actively manage the assets of our U.S. pension plans. We have
established asset allocation targets and investment guidelines with each investment manager. Our asset allocation targets promote
optimal expected return and volatility characteristics given the long-term time horizon for fulfilling the obligations of the plan.
Selection of the targeted asset allocation for U.S. plan assets was based upon a review of the expected return and risk characteristics of
each asset class, as well as the correlation of returns among asset classes. During 2012, the Company revised the asset allocation targets
and restructured the investment manager composition to further diversify investment risk and reduce volatility while maintaining
our long-term return objectives. Our revised target allocation is a mix of 42 percent equity investments, 30 percent fixed-income
investments and 28 percent alternative investments. We believe this target allocation will enable us to achieve the following long-term
investment objectives:
(1) optimize the long-term return on plan assets at an acceptable level of risk;
(2) maintain a broad diversification across asset classes and among investment managers; and
(3) maintain careful control of the risk level within each asset class.
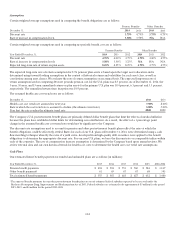
The guidelines that have been established with each investment manager provide parameters within which the investment managers
agree to operate, including criteria that determine eligible and ineligible securities, diversification requirements and credit quality
standards, where applicable. Unless exceptions have been approved, investment managers are prohibited from buying or selling
commodities, futures or option contracts, as well as from short selling of securities. Additionally, investment managers agree to obtain
written approval for deviations from stated investment style or guidelines. As of December 31, 2014, no investment manager was
responsible for more than 10 percent of total U.S. plan assets.