Coca Cola 2014 Annual Report Download - page 72
Download and view the complete annual report
Please find page 72 of the 2014 Coca Cola annual report below. You can navigate through the pages in the report by either clicking on the pages listed below, or by using the keyword search tool below to find specific information within the annual report.-
 1
1 -
2
-
3
-
4
-
5
-
6
-
7
-
8
-
9
-
10
-
11
-
12
-
13
-
14
-
15
-
16
-
17
-
18
-
19
-
20
-
21
-
22
-
23
-
24
-
25
-
26
-
27
-
28
-
29
-
30
-
31
-
32
-
33
-
34
-
35
-
36
-
37
-
38
-
39
-
40
-
41
-
42
-
43
-
44
-
45
-
46
-
47
-
48
-
49
-
50
-
51
-
52
-
53
-
54
-
55
-
56
-
57
-
58
-
59
-
60
-
61
-
 62
62 -
 63
63 -
 64
64 -
 65
65 -
 66
66 -
 67
67 -
 68
68 -
 69
69 -
 70
70 -
 71
71 -
 72
72 -
 73
73 -
 74
74 -
 75
75 -
 76
76 -
 77
77 -
 78
78 -
 79
79 -
 80
80 -
 81
81 -
 82
82 -
83
-
84
-
85
-
86
-
87
-
88
-
89
-
90
-
91
-
92
-
93
-
94
-
95
-
96
-
97
-
98
-
99
-
100
-
101
-
102
-
103
-
104
-
105
-
106
-
107
-
108
-
109
-
110
-
111
-
112
-
113
-
114
-
115
-
116
-
117
-
118
-
119
-
120
-
121
-
122
-
123
-
124
-
125
-
126
-
127
-
128
-
129
-
130
-
131
-
132
-
133
-
134
-
135
-
136
-
137
-
138
-
139
-
140
-
141
-
142
-
143
-
144
-
145
-
146
-
147
-
148
-
149
-
150
-
151
-
152
-
153
-
154
-
155
-
156
-
157
-
158
-
159
-
160
 |
 |
70
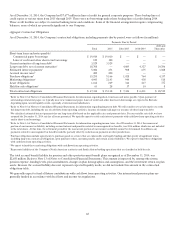
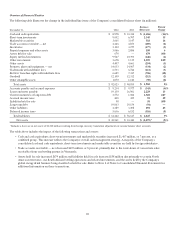
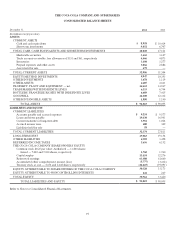
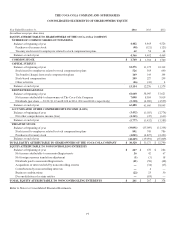
• Other investments increased $2,559 million, or 229 percent, primarily due to the Company’s investment in Keurig, which is
accounted for as an available-for-sale security. Refer to Note 2 of Notes to Consolidated Financial Statements for additional
information on this investment.
• Loans and notes payable increased $2,229 million, or 13 percent, and current maturities of long-term debt increased
$2,528 million, or 247 percent, primarily due to the net issuances of commercial paper during 2014, and the reclassification of
long-term debt that is scheduled to mature within a year from the line item long-term debt.
• Long-term debt decreased $91 million due to the reclassification of certain portions of the Company’s long-term debt into
the line item current maturities of long-term debt since it is scheduled to mature within a year, offset by the issuances of debt
during the year ended December 31, 2014.
• Other liabilities increased $891 million, or 25 percent, primarily due to the increase in pension plan liabilities as a result of a
decrease in the weighted-average discount rate and unfavorable pension asset performance compared to our expected return
during 2014, partially offset by current year contributions. Refer to Note 13 of Notes to Consolidated Financial Statements for
additional information on the Company’s pension plans.
• Deferred income taxes decreased $516 million, or 8 percent, primarily due to the impact related to the net changes in the
Company’s U.S. pension plan assumptions as well as the impact of the refranchising of certain North American territories.
Refer to Note 2 of Notes to Consolidated Financial Statements for additional information on the North America refranchising
and Note 13 of Notes to Consolidated Financial Statements for additional information on the Company’s deferred income
taxes.
ITEM 7A. QUANTITATIVE AND QUALITATIVE DISCLOSURES ABOUT MARKET RISK
Our Company uses derivative financial instruments primarily to reduce our exposure to adverse fluctuations in foreign currency
exchange rates, interest rates, commodity prices and other market risks. We do not enter into derivative financial instruments for
trading purposes. As a matter of policy, all of our derivative positions are used to reduce risk by hedging an underlying economic
exposure. Because of the high correlation between the hedging instrument and the underlying exposure, fluctuations in the value of
the instruments are generally offset by reciprocal changes in the value of the underlying exposure. The Company generally hedges
anticipated exposures up to 36 months in advance; however, the majority of our derivative instruments expire within 24 months or less.
Virtually all of our derivatives are straightforward over-the-counter instruments with liquid markets.
We monitor our exposure to financial market risks using several objective measurement systems, including a sensitivity analysis to
measure our exposure to fluctuations in foreign currency exchange rates, interest rates and commodity prices. Refer to Note 5 of Notes
to Consolidated Financial Statements for additional information about our hedging transactions and derivative financial instruments.
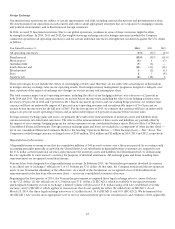
Foreign Currency Exchange Rates
We manage most of our foreign currency exposures on a consolidated basis, which allows us to net certain exposures and take
advantage of any natural offsets. In 2014, we used 71 functional currencies and generated $26,235 million of our net operating
revenues from operations outside the United States; therefore, weakness in one particular currency might be offset by strength in
other currencies over time. We use derivative financial instruments to further reduce our net exposure to foreign currency fluctuations.
Our Company enters into forward exchange contracts and purchases currency options (principally euros and Japanese yen) and collars
to hedge certain portions of forecasted cash flows denominated in foreign currencies. Additionally, we enter into forward exchange
contracts to offset the earnings impact related to foreign currency fluctuations on certain monetary assets and liabilities. We also enter
into forward exchange contracts as hedges of net investments in international operations.
The total notional values of our foreign currency derivatives were $23,553 million and $15,341 million as of December 31, 2014 and
2013, respectively. This total includes derivative instruments that are designated and qualify for hedge accounting as well as economic
hedges. The fair value of the contracts that qualify for hedge accounting resulted in an asset of $996 million as of December 31, 2014.
At the end of 2014, we estimate that a 10 percent weakening of the U.S. dollar would have eliminated the net unrealized gain and
created an unrealized loss of $103 million. The fair value of the contracts that do not qualify for hedge accounting resulted in an asset
of $221 million, and we estimate that a 10 percent weakening of the U.S. dollar would have increased our net gains by $304 million.