Coca Cola 2014 Annual Report Download - page 92
Download and view the complete annual report
Please find page 92 of the 2014 Coca Cola annual report below. You can navigate through the pages in the report by either clicking on the pages listed below, or by using the keyword search tool below to find specific information within the annual report.-
 1
1 -
2
-
3
-
4
-
5
-
6
-
7
-
8
-
9
-
10
-
11
-
12
-
13
-
14
-
15
-
16
-
17
-
18
-
19
-
20
-
21
-
22
-
23
-
24
-
25
-
26
-
27
-
28
-
29
-
30
-
31
-
32
-
33
-
34
-
35
-
36
-
37
-
38
-
39
-
40
-
41
-
42
-
43
-
44
-
45
-
46
-
47
-
48
-
49
-
50
-
51
-
52
-
53
-
54
-
55
-
56
-
57
-
58
-
59
-
60
-
61
-
62
-
63
-
64
-
65
-
66
-
67
-
68
-
69
-
70
-
71
-
72
-
73
-
74
-
75
-
76
-
77
-
78
-
79
-
80
-
81
-
 82
82 -
 83
83 -
 84
84 -
 85
85 -
 86
86 -
 87
87 -
 88
88 -
 89
89 -
 90
90 -
 91
91 -
 92
92 -
 93
93 -
 94
94 -
 95
95 -
 96
96 -
 97
97 -
 98
98 -
 99
99 -
 100
100 -
 101
101 -
 102
102 -
103
-
104
-
105
-
106
-
107
-
108
-
109
-
110
-
111
-
112
-
113
-
114
-
115
-
116
-
117
-
118
-
119
-
120
-
121
-
122
-
123
-
124
-
125
-
126
-
127
-
128
-
129
-
130
-
131
-
132
-
133
-
134
-
135
-
136
-
137
-
138
-
139
-
140
-
141
-
142
-
143
-
144
-
145
-
146
-
147
-
148
-
149
-
150
-
151
-
152
-
153
-
154
-
155
-
156
-
157
-
158
-
159
-
160
 |
 |

90
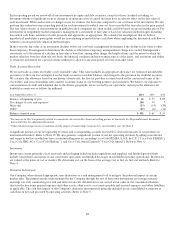
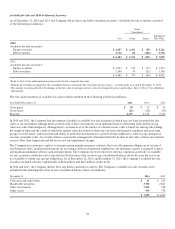
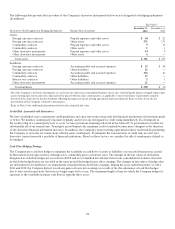
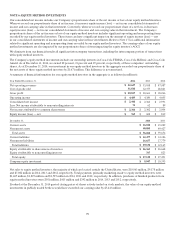
The following table presents information related to the major classes of assets and liabilities that were classified as held for sale in our
consolidated balance sheet (in millions):
December 31, 2014
Cash, cash equivalents and short-term investments
$ 30
Trade accounts receivable, less allowances
100
Inventories 54
Prepaid expenses and other assets 7
Equity method investments 141
Other assets
3
Property, plant and equipment — net
303
Bottlers’ franchise rights with indefinite lives 410
Trademarks 43
Goodwill
46
Other intangible assets 36
Allowance for reduction of assets held for sale
(494)
Total assets
$ 679
Accounts payable and accrued expenses
$ 48
Other liabilities
6
Deferred income taxes
4
Total liabilities
$ 58
Included in the amounts above are total assets relating to North America refranchising of $223 million, Coca-Cola Beverages Africa
Limited of $333 million, the pending Monster transaction of $43 million, and other assets held for sale of $80 million, and are included
in the North America, Eurasia and Africa, Bottling Investments and Corporate operating segments. We determined that these
operations did not meet the criteria to be classified as discontinued operations, primarily due to the continued significant involvement
we will have in these operations following each transaction.
NOTE 3: INVESTMENTS
Investments in debt and marketable securities, other than investments accounted for under the equity method, are classified as trading,
available-for-sale or held-to-maturity. Our marketable equity investments are classified as either trading or available-for-sale with
their cost basis determined by the specific identification method. Our investments in debt securities are carried at either amortized
cost or fair value. Investments in debt securities that the Company has the positive intent and ability to hold to maturity are carried at
amortized cost and classified as held-to-maturity. Investments in debt securities that are not classified as held-to-maturity are carried
at fair value and classified as either trading or available-for-sale. Realized and unrealized gains and losses on trading securities and
realized gains and losses on available-for-sale securities are included in net income. Unrealized gains and losses, net of deferred taxes,
on available-for-sale securities are included in our consolidated balance sheets as a component of AOCI, except for the change in fair
value attributable to the currency risk being hedged. Refer to Note 5 for additional information related to the Company’s fair value
hedges of available-for-sale securities.
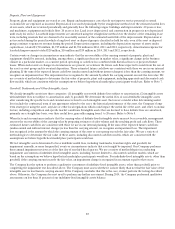
Trading Securities
As of December 31, 2014 and 2013, our trading securities had a fair value of $409 million and $372 million, respectively, and consisted
primarily of equity securities. The Company had net unrealized gains on trading securities of $40 million, $12 million, and $19 million
as of December 31, 2014, 2013 and 2012, respectively.
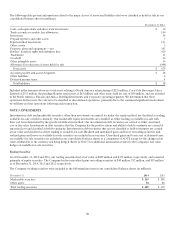
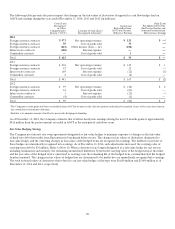
The Company’s trading securities were included in the following line items in our consolidated balance sheets (in millions):
December 31, 2014 2013
Marketable securities
$ 315 $ 286
Other assets 94 86
Total trading securities
$ 409 $ 372