Coca Cola 2014 Annual Report Download - page 30
Download and view the complete annual report
Please find page 30 of the 2014 Coca Cola annual report below. You can navigate through the pages in the report by either clicking on the pages listed below, or by using the keyword search tool below to find specific information within the annual report.-
 1
1 -
2
-
3
-
4
-
5
-
6
-
7
-
8
-
9
-
10
-
11
-
12
-
13
-
14
-
15
-
16
-
17
-
18
-
19
-
 20
20 -
 21
21 -
 22
22 -
 23
23 -
 24
24 -
 25
25 -
 26
26 -
 27
27 -
 28
28 -
 29
29 -
 30
30 -
 31
31 -
 32
32 -
 33
33 -
 34
34 -
 35
35 -
 36
36 -
 37
37 -
 38
38 -
 39
39 -
 40
40 -
41
-
42
-
43
-
44
-
45
-
46
-
47
-
48
-
49
-
50
-
51
-
52
-
53
-
54
-
55
-
56
-
57
-
58
-
59
-
60
-
61
-
62
-
63
-
64
-
65
-
66
-
67
-
68
-
69
-
70
-
71
-
72
-
73
-
74
-
75
-
76
-
77
-
78
-
79
-
80
-
81
-
82
-
83
-
84
-
85
-
86
-
87
-
88
-
89
-
90
-
91
-
92
-
93
-
94
-
95
-
96
-
97
-
98
-
99
-
100
-
101
-
102
-
103
-
104
-
105
-
106
-
107
-
108
-
109
-
110
-
111
-
112
-
113
-
114
-
115
-
116
-
117
-
118
-
119
-
120
-
121
-
122
-
123
-
124
-
125
-
126
-
127
-
128
-
129
-
130
-
131
-
132
-
133
-
134
-
135
-
136
-
137
-
138
-
139
-
140
-
141
-
142
-
143
-
144
-
145
-
146
-
147
-
148
-
149
-
150
-
151
-
152
-
153
-
154
-
155
-
156
-
157
-
158
-
159
-
160
 |
 |
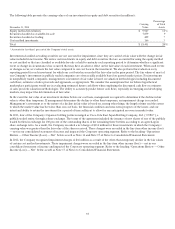
28
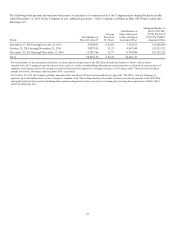
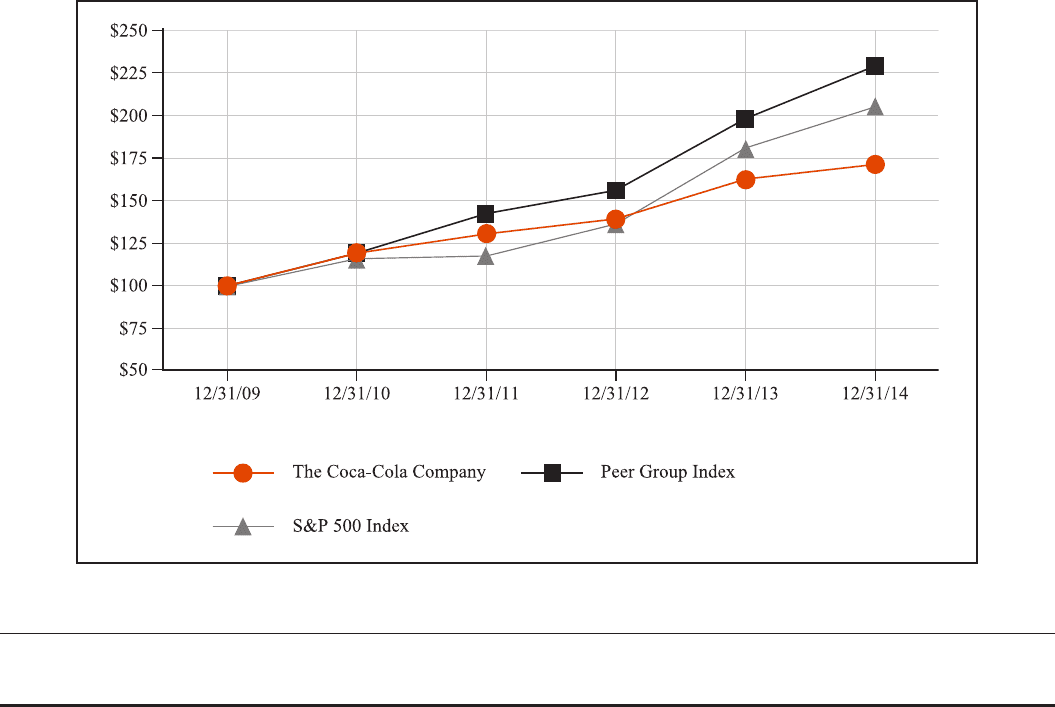
Performance Graph
Comparison of Five-Year Cumulative Total Return Among
The Coca-Cola Company, the Peer Group Index and the S&P 500 Index
Total Return
Stock Price Plus Reinvested Dividends
December 31, 2009 2010 2011 2012 2013 2014
The Coca-Cola Company $ 100 $ 119 $ 130 $ 139 $ 163 $ 171
Peer Group
Index
100 119 142 156 198 229
S&P 500
Index
100 115 117 136 180 205
The total return assumes that dividends were reinvested daily and is based on a $100 investment on December 31, 2009.
The Peer Group Index is a self-constructed peer group of companies that are included in the Dow Jones Food and Beverage Group
and the Dow Jones Tobacco Group of companies, from which the Company has been excluded.
The Peer Group Index consists of the following companies: Altria Group, Inc., Archer Daniels Midland Company, B&G Foods,
Inc., Brown-Forman Corporation, Bunge Limited, Campbell Soup Company, Coca-Cola Enterprises, Inc., ConAgra Foods, Inc.,
Constellation Brands, Inc., Darling Ingredients Inc., Dean Foods Company, Dr Pepper Snapple Group, Inc., Flowers Foods, Inc.,
General Mills, Inc., The Hain Celestial Group, Inc., Herbalife Ltd., The Hershey Company, Hormel Foods Corporation, Ingredion
Incorporated, The J.M. Smucker Company, Kellogg Company, Keurig Green Mountain, Inc., Kraft Foods Inc., Lancaster Colony
Corporation, Leucadia National Corporation, Lorillard, Inc., McCormick & Company, Inc., Mead Johnson Nutrition Company,
Molson Coors Brewing Company, Mondel-
ez International, Inc., Monster Beverage Corporation, PepsiCo, Inc., Philip Morris
International Inc., Post Holdings, Inc., Reynolds American Inc., TreeHouse Foods, Inc., Tyson Foods, Inc., and The WhiteWave
Foods Company.
Companies included in the Dow Jones Food and Beverage Group and the Dow Jones Tobacco Group change periodically. This year,
the groups do not include Beam Inc., The Hillshire Brands Company and Universal Corporation, all of which were included in the
groups last year.