Coca Cola 2014 Annual Report Download - page 49
Download and view the complete annual report
Please find page 49 of the 2014 Coca Cola annual report below. You can navigate through the pages in the report by either clicking on the pages listed below, or by using the keyword search tool below to find specific information within the annual report.-
 1
1 -
2
-
3
-
4
-
5
-
6
-
7
-
8
-
9
-
10
-
11
-
12
-
13
-
14
-
15
-
16
-
17
-
18
-
19
-
20
-
21
-
22
-
23
-
24
-
25
-
26
-
27
-
28
-
29
-
30
-
31
-
32
-
33
-
34
-
35
-
36
-
37
-
38
-
 39
39 -
 40
40 -
 41
41 -
 42
42 -
 43
43 -
 44
44 -
 45
45 -
 46
46 -
 47
47 -
 48
48 -
 49
49 -
 50
50 -
 51
51 -
 52
52 -
 53
53 -
 54
54 -
 55
55 -
 56
56 -
 57
57 -
 58
58 -
 59
59 -
60
-
61
-
62
-
63
-
64
-
65
-
66
-
67
-
68
-
69
-
70
-
71
-
72
-
73
-
74
-
75
-
76
-
77
-
78
-
79
-
80
-
81
-
82
-
83
-
84
-
85
-
86
-
87
-
88
-
89
-
90
-
91
-
92
-
93
-
94
-
95
-
96
-
97
-
98
-
99
-
100
-
101
-
102
-
103
-
104
-
105
-
106
-
107
-
108
-
109
-
110
-
111
-
112
-
113
-
114
-
115
-
116
-
117
-
118
-
119
-
120
-
121
-
122
-
123
-
124
-
125
-
126
-
127
-
128
-
129
-
130
-
131
-
132
-
133
-
134
-
135
-
136
-
137
-
138
-
139
-
140
-
141
-
142
-
143
-
144
-
145
-
146
-
147
-
148
-
149
-
150
-
151
-
152
-
153
-
154
-
155
-
156
-
157
-
158
-
159
-
160
 |
 |

47
Unit case volume for Bottling Investments decreased 17 percent. This decrease primarily reflects the sale of a majority ownership
interest in our previously consolidated bottling operations in the Philippines to Coca-Cola FEMSA, S.A.B. de C.V. (“Coca-Cola
FEMSA”) in January 2013, as well as the deconsolidation of our bottling operations in Brazil during July 2013 as a result of their
combination with an independent bottling partner. The unfavorable impact of these transactions on the group’s unit case volume
results was partially offset by growth in other key markets, including China and India, where we own or otherwise consolidate bottling
operations. The Company’s consolidated bottling operations accounted for 35 percent and 65 percent of the unit case volume in China
and India, respectively.
Concentrate Sales Volume
In 2014, worldwide concentrate sales volume grew 2 percent and unit case volume grew 2 percent compared to 2013. After considering
the impact of structural changes, concentrate sales volume grew 1 percent during the year ended December 31, 2014. In 2013,
concentrate sales volume and unit case volume both grew 2 percent compared to 2012. The differences between concentrate sales
volume and unit case volume growth rates for individual operating segments in 2014 and 2013 were primarily due to the timing of
concentrate shipments and the impact of unit case volume from certain joint ventures in which the Company has an equity interest, but
to which the Company does not sell concentrates, syrups, beverage bases or powders.
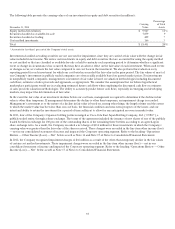
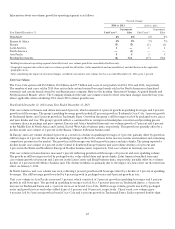
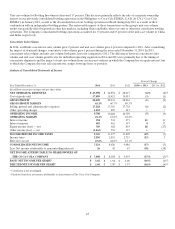
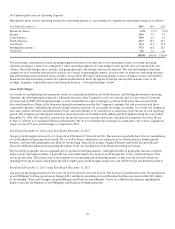
Analysis of Consolidated Statements of Income
Percent
Change
Year Ended December 31, 2014 2013 2012 2014 vs. 2013 2013 vs. 2012
(In millions except percentages and per share data)
NET OPERATING REVENUES $ 45,998 $ 46,854 $ 48,017 (2)% (2)%
Cost of goods sold 17,889 18,421 19,053 (3) (3)
GROSS
PROFIT
28,109 28,433 28,964 (1) (2)
GROSS PROFIT MARGIN 61.1% 60.7% 60.3%
Selling, general and administrative expenses 17,218 17,310 17,738 (1) (2)
Other operating charges 1,183 895 447 **
OPERATING
INCOME
9,708 10,228 10,779 (5) (5)
OPERATING MARGIN 21.1% 21.8% 22.4
%
Interest income 594 534 471 11 13
Interest expense 483 463 397 417
Equity income (loss) — net 769 602 819 28 (27)
Other income (loss) — net (1,263) 576 137 **
INCOME BEFORE INCOME TAXES 9,325 11,477 11,809 (19) (3)
Income taxes 2,201 2,851 2,723 (23) 5
Effective tax rate 23.6% 24.8% 23.1%
CONSOLIDATED NET
INCOME
7,124 8,626 9,086 (17) (5)
Less: Net income attributable to noncontrolling interests 26 42 67 (38) (38)
NET INCOME ATTRIBUTABLE TO SHAREOWNERS OF
THE COCA-COLA COMPANY $ 7,098 $ 8,584 $ 9,019 (17)% (5)%
BASIC NET INCOME PER SHARE1$ 1.62 $ 1.94 $ 2.00 (16)% (3)%
DILUTED NET INCOME PER SHARE1$ 1.60 $ 1.90 $ 1.97 (16)% (4)%
* Calculation is not meaningful.
1
Calculated based on net income attributable to shareowners of The Coca-Cola Company.