Coca Cola 2014 Annual Report Download - page 94
Download and view the complete annual report
Please find page 94 of the 2014 Coca Cola annual report below. You can navigate through the pages in the report by either clicking on the pages listed below, or by using the keyword search tool below to find specific information within the annual report.-
 1
1 -
2
-
3
-
4
-
5
-
6
-
7
-
8
-
9
-
10
-
11
-
12
-
13
-
14
-
15
-
16
-
17
-
18
-
19
-
20
-
21
-
22
-
23
-
24
-
25
-
26
-
27
-
28
-
29
-
30
-
31
-
32
-
33
-
34
-
35
-
36
-
37
-
38
-
39
-
40
-
41
-
42
-
43
-
44
-
45
-
46
-
47
-
48
-
49
-
50
-
51
-
52
-
53
-
54
-
55
-
56
-
57
-
58
-
59
-
60
-
61
-
62
-
63
-
64
-
65
-
66
-
67
-
68
-
69
-
70
-
71
-
72
-
73
-
74
-
75
-
76
-
77
-
78
-
79
-
80
-
81
-
82
-
83
-
 84
84 -
 85
85 -
 86
86 -
 87
87 -
 88
88 -
 89
89 -
 90
90 -
 91
91 -
 92
92 -
 93
93 -
 94
94 -
 95
95 -
 96
96 -
 97
97 -
 98
98 -
 99
99 -
 100
100 -
 101
101 -
 102
102 -
 103
103 -
 104
104 -
105
-
106
-
107
-
108
-
109
-
110
-
111
-
112
-
113
-
114
-
115
-
116
-
117
-
118
-
119
-
120
-
121
-
122
-
123
-
124
-
125
-
126
-
127
-
128
-
129
-
130
-
131
-
132
-
133
-
134
-
135
-
136
-
137
-
138
-
139
-
140
-
141
-
142
-
143
-
144
-
145
-
146
-
147
-
148
-
149
-
150
-
151
-
152
-
153
-
154
-
155
-
156
-
157
-
158
-
159
-
160
 |
 |

92
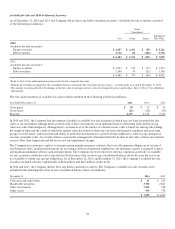
The contractual maturities of these investments as of December 31, 2014, were as follows (in millions):
Available-for-Sale Securities
Cost Fair Value
Within 1 year $ 1,589 $ 1,489
After 1 year through 5 years 1,709 1,747
After 5 years through 10 years 118 130
After 10 years 380 392
Equity securities 2,687 4,121
$ 6,483 $ 7,879
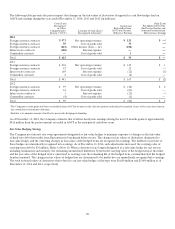
The Company expects that actual maturities may differ from the contractual maturities above because borrowers have the right to call
or prepay certain obligations.
Cost Method Investments
Cost method investments are initially recorded at cost, and we record dividend income when applicable dividends are declared. Cost
method investments are reported as other investments in our consolidated balance sheets, and dividend income from cost method
investments is reported in other income (loss) — net in our consolidated statements of income. We review all of our cost method
investments quarterly to determine if impairment indicators are present; however, we are not required to determine the fair value
of these investments unless impairment indicators exist. When impairment indicators exist, we generally use discounted cash flow
analyses to determine the fair value. We estimate that the fair values of our cost method investments approximated or exceeded their
carrying values as of December 31, 2014 and 2013. Our cost method investments had a carrying value of $166 million and $162 million
as of December 31, 2014 and 2013, respectively.
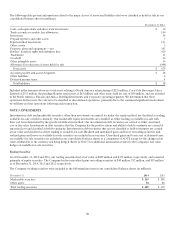
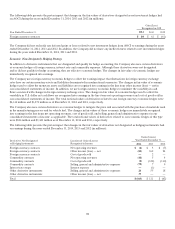
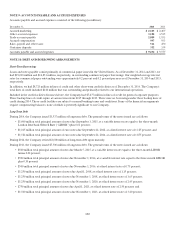
NOTE 4: INVENTORIES
Inventories consist primarily of raw materials and packaging (which includes ingredients and supplies) and finished goods (which
include concentrates and syrups in our concentrate operations and finished beverages in our finished product operations). Inventories
are valued at the lower of cost or market. We determine cost on the basis of the average cost or first-in, first-out methods. Inventories
consisted of the following (in millions):
December 31, 2014 2013
Raw materials and packaging $ 1,615 $ 1,692
Finished goods 1,134 1,240
Other 351 345
Total inventories $ 3,100 $ 3,277
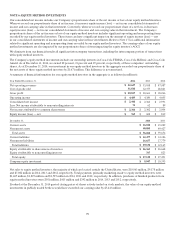
NOTE 5: HEDGING TRANSACTIONS AND DERIVATIVE FINANCIAL INSTRUMENTS
The Company is directly and indirectly affected by changes in certain market conditions. These changes in market conditions
may adversely impact the Company’s financial performance and are referred to as “market risks.” Our Company, when deemed
appropriate, uses derivatives as a risk management tool to mitigate the potential impact of certain market risks. The primary market
risks managed by the Company through the use of derivative instruments are foreign currency exchange rate risk, commodity price risk
and interest rate risk.
The Company uses various types of derivative instruments including, but not limited to, forward contracts, commodity futures
contracts, option contracts, collars and swaps. Forward contracts and commodity futures contracts are agreements to buy or sell a
quantity of a currency or commodity at a predetermined future date, and at a predetermined rate or price. An option contract is
an agreement that conveys the purchaser the right, but not the obligation, to buy or sell a quantity of a currency or commodity at
a predetermined rate or price during a period or at a time in the future. A collar is a strategy that uses a combination of options to
limit the range of possible positive or negative returns on an underlying asset or liability to a specific range, or to protect expected
future cash flows. To do this, an investor simultaneously buys a put option and sells (writes) a call option, or alternatively buys a call
option and sells (writes) a put option. A swap agreement is a contract between two parties to exchange cash flows based on specified
underlying notional amounts, assets and/or indices. We do not enter into derivative financial instruments for trading purposes.
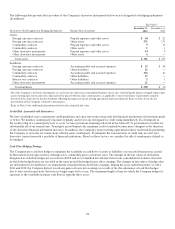
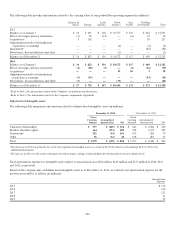
All derivatives are carried at fair value in our consolidated balance sheets in the following line items, as applicable: prepaid
expenses and other assets; other assets; accounts payable and accrued expenses; and other liabilities. The carrying values of the