Coca Cola 2014 Annual Report Download - page 55
Download and view the complete annual report
Please find page 55 of the 2014 Coca Cola annual report below. You can navigate through the pages in the report by either clicking on the pages listed below, or by using the keyword search tool below to find specific information within the annual report.-
 1
1 -
2
-
3
-
4
-
5
-
6
-
7
-
8
-
9
-
10
-
11
-
12
-
13
-
14
-
15
-
16
-
17
-
18
-
19
-
20
-
21
-
22
-
23
-
24
-
25
-
26
-
27
-
28
-
29
-
30
-
31
-
32
-
33
-
34
-
35
-
36
-
37
-
38
-
39
-
40
-
41
-
42
-
43
-
44
-
 45
45 -
 46
46 -
 47
47 -
 48
48 -
 49
49 -
 50
50 -
 51
51 -
 52
52 -
 53
53 -
 54
54 -
 55
55 -
 56
56 -
 57
57 -
 58
58 -
 59
59 -
 60
60 -
 61
61 -
 62
62 -
 63
63 -
 64
64 -
 65
65 -
66
-
67
-
68
-
69
-
70
-
71
-
72
-
73
-
74
-
75
-
76
-
77
-
78
-
79
-
80
-
81
-
82
-
83
-
84
-
85
-
86
-
87
-
88
-
89
-
90
-
91
-
92
-
93
-
94
-
95
-
96
-
97
-
98
-
99
-
100
-
101
-
102
-
103
-
104
-
105
-
106
-
107
-
108
-
109
-
110
-
111
-
112
-
113
-
114
-
115
-
116
-
117
-
118
-
119
-
120
-
121
-
122
-
123
-
124
-
125
-
126
-
127
-
128
-
129
-
130
-
131
-
132
-
133
-
134
-
135
-
136
-
137
-
138
-
139
-
140
-
141
-
142
-
143
-
144
-
145
-
146
-
147
-
148
-
149
-
150
-
151
-
152
-
153
-
154
-
155
-
156
-
157
-
158
-
159
-
160
 |
 |

53
enable us to service our customers and consumers. We believe these efforts will create annualized productivity of $200 million to
$250 million.
As a combined productivity and reinvestment program, the Company anticipates generating annualized productivity of $550 million to
$650 million, which will be reinvested in brand-building initiatives.
In February 2014, the Company announced that we are expanding our productivity and reinvestment program to drive an incremental
$1 billion in productivity by 2016 that will primarily be redirected into increased media investments. Our incremental productivity goal
consists of two relatively equal components. First, expanded savings through global supply chain optimization, data and information
technology system standardization, and resource and cost reallocation, which will be reinvested in global brand-building initiatives,
with an emphasis on increased media spending. Second, we will be increasing the effectiveness of our marketing investments by
transforming our marketing and commercial model to redeploy resources into more consumer-facing marketing investments to
accelerate growth.
In October 2014, the Company announced that we are further expanding our productivity and reinvestment program and extending
it through 2019. The expansion of the productivity initiatives will focus on four key areas: restructuring the Company’s global supply
chain, including manufacturing in North America; implementing zero-based budgeting across the organization; streamlining and
simplifying the Company’s operating model; and further driving increased discipline and efficiency in direct marketing investments.
The Company expects that the expanded productivity initiatives will generate an incremental $2 billion in annualized productivity. This
productivity will enable the Company to fund marketing initiatives and innovation required to deliver sustainable net revenue growth
and will also support margin expansion and increased returns on invested capital over time. Refer to Note 18 of Notes to Consolidated
Financial Statements.
We expect to achieve total annualized productivity of approximately $3.6 billion by 2019 from the initiatives implemented under this
program since it began in 2012.
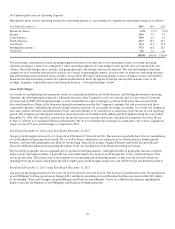
Integration of Our German Bottling and Distribution Operations
In 2008, the Company began the integration of 18 German bottling and distribution operations acquired in 2007. Since the integration
commenced, the Company has incurred total pretax expenses of $835 million primarily related to involuntary terminations. The
Company is currently reviewing other restructuring opportunities within the German bottling and distribution operations, which if
implemented will result in additional charges in future periods. However, as of December 31, 2014, the Company had not finalized any
additional restructuring plans. The Company does anticipate incurring additional integration costs related to information technology
and other initiatives. Refer to Note 18 of Notes to Consolidated Financial Statements.
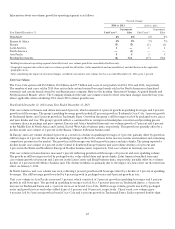
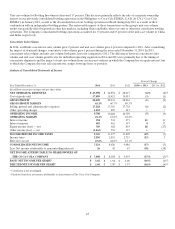
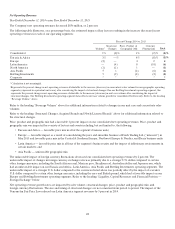
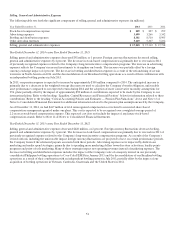
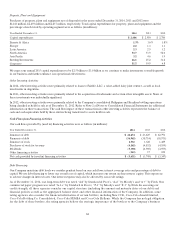
Operating Income and Operating Margin
Information about our operating income contribution by operating segment on a percentage basis is as follows:
Year Ended December 31, 2014
2013
2012
Eurasia &
Africa
11.2%
10.6
%
10.0
%
Europe 29.4 28.0 27.5
Latin
America
23.8 28.4 26.7
North
America
25.2 23.8 24.1
Asia Pacific 25.2 24.2 23.3
Bottling
Investments
0.1 1.1 1.3
Corporate (14.9) (16.1) (12.9)
Total 100.0% 100.0% 100.0%