Coca Cola 2014 Annual Report Download - page 116
Download and view the complete annual report
Please find page 116 of the 2014 Coca Cola annual report below. You can navigate through the pages in the report by either clicking on the pages listed below, or by using the keyword search tool below to find specific information within the annual report.-
 1
1 -
2
-
3
-
4
-
5
-
6
-
7
-
8
-
9
-
10
-
11
-
12
-
13
-
14
-
15
-
16
-
17
-
18
-
19
-
20
-
21
-
22
-
23
-
24
-
25
-
26
-
27
-
28
-
29
-
30
-
31
-
32
-
33
-
34
-
35
-
36
-
37
-
38
-
39
-
40
-
41
-
42
-
43
-
44
-
45
-
46
-
47
-
48
-
49
-
50
-
51
-
52
-
53
-
54
-
55
-
56
-
57
-
58
-
59
-
60
-
61
-
62
-
63
-
64
-
65
-
66
-
67
-
68
-
69
-
70
-
71
-
72
-
73
-
74
-
75
-
76
-
77
-
78
-
79
-
80
-
81
-
82
-
83
-
84
-
85
-
86
-
87
-
88
-
89
-
90
-
91
-
92
-
93
-
94
-
95
-
96
-
97
-
98
-
99
-
100
-
101
-
102
-
103
-
104
-
105
-
 106
106 -
 107
107 -
 108
108 -
 109
109 -
 110
110 -
 111
111 -
 112
112 -
 113
113 -
 114
114 -
 115
115 -
 116
116 -
 117
117 -
 118
118 -
 119
119 -
 120
120 -
 121
121 -
 122
122 -
 123
123 -
 124
124 -
 125
125 -
 126
126 -
127
-
128
-
129
-
130
-
131
-
132
-
133
-
134
-
135
-
136
-
137
-
138
-
139
-
140
-
141
-
142
-
143
-
144
-
145
-
146
-
147
-
148
-
149
-
150
-
151
-
152
-
153
-
154
-
155
-
156
-
157
-
158
-
159
-
160
 |
 |

114
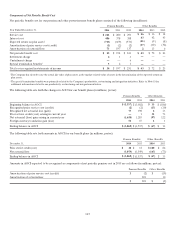
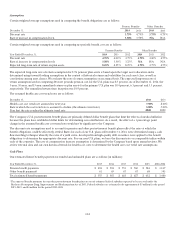
Assumptions
Certain weighted-average assumptions used in computing the benefit obligations are as follows:
Pension
Benefits
Other
Benefits
December 31, 2014 2013 2014 2013
Discount rate 3.75%
4.75%
3.75%
4.75%
Rate of increase in compensation levels 3.50%
3.50%
N/A
N/A
Certain weighted-average assumptions used in computing net periodic benefit cost are as follows:
P
ension Benefits Other Benefits
Year Ended December 31, 2014 2013 2012 2014 2013 2012
Discount rate 4.75% 4.00% 4.75% 4.75% 4.00% 4.75%
Rate of increase in compensation
levels
3.50% 3.50% 3.25% N/A N/A N/A
Expected long-term rate of return on plan assets 8.25% 8.25% 8.25% 4.75% 4.75% 4.75%
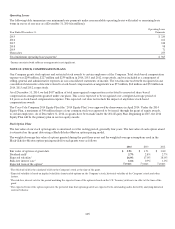
The expected long-term rate of return assumption for U.S. pension plan assets is based upon the target asset allocation and is
determined using forward-looking assumptions in the context of historical returns and volatilities for each asset class, as well as
correlations among asset classes. We evaluate the rate of return assumption on an annual basis. The expected long-term rate of
return assumption used in computing 2014 net periodic pension cost for the U.S. plans was 8.5 percent. As of December 31, 2014, the
5-year, 10-year, and 15-year annualized return on plan assets for the primary U.S. plan was 10.4 percent, 6.3 percent and 5.5 percent,
respectively. The annualized return since inception was 10.9 percent.
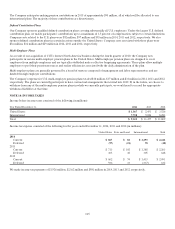
The assumed health care cost trend rates are as follows:
December 31, 2014 2013
Health care cost trend rate assumed for next
year
7.50% 8.00%
Rate to which the cost trend rate is assumed to decline (the ultimate trend
rate)
5.00% 5.00%
Year that the rate reaches the ultimate trend
rate
2020 2020
The Company’s U.S. postretirement benefit plans are primarily defined dollar benefit plans that limit the effects of medical inflation
because the plans have established dollar limits for determining our contributions. As a result, the effect of a 1 percentage point
change in the assumed health care cost trend rate would not be significant to the Company.
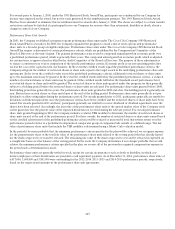
The discount rate assumptions used to account for pension and other postretirement benefit plans reflect the rates at which the
benefit obligations could be effectively settled. Rates for each of our U.S. plans at December 31, 2014, were determined using a cash
flow matching technique whereby the rates of a yield curve, developed from high-quality debt securities, were applied to the benefit
obligations to determine the appropriate discount rate. For our non-U.S. plans, we base the discount rate on comparable indices within
each of the countries. The rate of compensation increase assumption is determined by the Company based upon annual reviews. We
review external data and our own historical trends for health care costs to determine the health care cost trend rate assumptions.
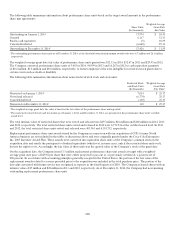
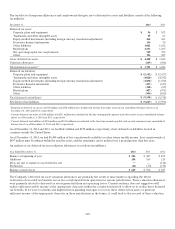
Cash Flows
Our estimated future benefit payments for funded and unfunded plans are as follows (in millions):
Year Ended December 31, 2015 2016 2017 2018 2019 2020–2024
Pension benefit
payments
$
494
$ 518 $ 551 $ 560 $ 584 $ 3,137
Other benefit
payments
161 65 67 67 68 343
Total estimated benefit
payments
$
555
$ 583 $ 618 $ 627 $ 652 $ 3,480
1 The expected benefit payments for our other postretirement benefit plans are net of estimated federal subsidies expected to be received under the
Medicare Prescription Drug, Improvement and Modernization Act of 2003. Federal subsidies are estimated to be approximately $5 million for the period
2015–2019, and $4 million for the period 2020–2024.