Coca Cola 2014 Annual Report Download - page 131
Download and view the complete annual report
Please find page 131 of the 2014 Coca Cola annual report below. You can navigate through the pages in the report by either clicking on the pages listed below, or by using the keyword search tool below to find specific information within the annual report.-
 1
1 -
2
-
3
-
4
-
5
-
6
-
7
-
8
-
9
-
10
-
11
-
12
-
13
-
14
-
15
-
16
-
17
-
18
-
19
-
20
-
21
-
22
-
23
-
24
-
25
-
26
-
27
-
28
-
29
-
30
-
31
-
32
-
33
-
34
-
35
-
36
-
37
-
38
-
39
-
40
-
41
-
42
-
43
-
44
-
45
-
46
-
47
-
48
-
49
-
50
-
51
-
52
-
53
-
54
-
55
-
56
-
57
-
58
-
59
-
60
-
61
-
62
-
63
-
64
-
65
-
66
-
67
-
68
-
69
-
70
-
71
-
72
-
73
-
74
-
75
-
76
-
77
-
78
-
79
-
80
-
81
-
82
-
83
-
84
-
85
-
86
-
87
-
88
-
89
-
90
-
91
-
92
-
93
-
94
-
95
-
96
-
97
-
98
-
99
-
100
-
101
-
102
-
103
-
104
-
105
-
106
-
107
-
108
-
109
-
110
-
111
-
112
-
113
-
114
-
115
-
116
-
117
-
118
-
119
-
120
-
 121
121 -
 122
122 -
 123
123 -
 124
124 -
 125
125 -
 126
126 -
 127
127 -
 128
128 -
 129
129 -
 130
130 -
 131
131 -
 132
132 -
 133
133 -
 134
134 -
 135
135 -
 136
136 -
 137
137 -
 138
138 -
 139
139 -
 140
140 -
 141
141 -
142
-
143
-
144
-
145
-
146
-
147
-
148
-
149
-
150
-
151
-
152
-
153
-
154
-
155
-
156
-
157
-
158
-
159
-
160
 |
 |
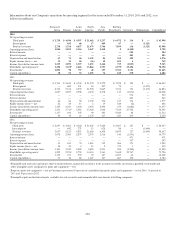
129
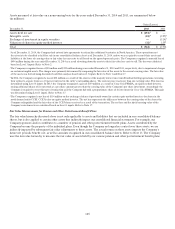
if the Company sold a proportionate share of its investment in Coca-Cola FEMSA. Refer to Note 16 for additional information on the
measurement of the gain and Note 19 for the impact this gain had on our operating segments.
In 2012, the Company recognized a gain of $185 million as a result of the merger of Andina and Polar, with Andina being the acquiring
company. Prior to this transaction, the Company held an investment in Andina that we accounted for as an available-for-sale security
as well as an investment in Polar that we accounted for under the equity method of accounting. The merger of the two companies was
a noncash transaction that resulted in Polar shareholders exchanging their existing Polar shares for newly issued shares of Andina
at a specified exchange rate. As a result, the Company now holds an investment in Andina that we account for as an equity method
investment. Refer to Note 19 for the impact this gain had on our operating segments.
On December 13, 2012, the Company and Coca-Cola FEMSA executed a share purchase agreement for the sale of a majority
ownership interest in our consolidated Philippine bottling operations. This transaction was completed on January 25, 2013. As a result
of this agreement, the Company was required to classify our Philippine bottling operations as held for sale in our consolidated balance
sheet as of December 31, 2012. We also recognized a loss of $108 million during the year ended December 31, 2012, based on the
agreed-upon sale price and related transaction costs. Refer to Note 19 for the impact this loss had on our operating segments.
The Company also recognized a gain of $92 million in 2012 as a result of Coca-Cola FEMSA issuing additional shares of its own stock
at a per share amount greater than the carrying value of the Company’s investment. Accordingly, the Company is required to treat this
type of transaction as if we sold a proportionate share of our investment in Coca-Cola FEMSA. Refer to Note 19 for the impact this
gain had on our operating segments.
During the year ended December 31, 2012, the Company recorded a charge of $82 million due to the acquisition of an ownership
interest in Mikuni for which we paid a premium over the publicly traded market price. Although the Company paid this premium to
obtain specific rights that have an economic and strategic value to the Company, they do not qualify as an asset and were recorded
as expense on the acquisition date. For the impact that this charge had on our operating segments, refer to Note 19. The Company
accounted for our investment in Mikuni under the equity method of accounting prior to the merger of the four bottlers into CCEJ
discussed above.
The Company also recognized charges of $16 million during the year ended December 31, 2012, due to other-than-temporary declines
in the fair values of certain cost method investments. Refer to Note 19 for the impact these charges had on our operating segments.
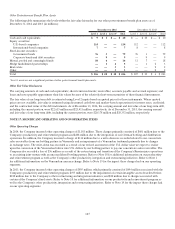
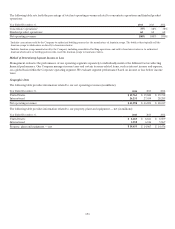
NOTE 18: PRODUCTIVITY, INTEGRATION AND RESTRUCTURING INITIATIVES
Productivity and Reinvestment
In February 2012, the Company announced a four-year productivity and reinvestment program which is designed to assist us
in strengthening our brands and reinvesting our resources to drive long-term profitable growth. This program is focused on the
following initiatives: global supply chain optimization; global marketing and innovation effectiveness; operating expense leverage and
operational excellence; data and information technology systems standardization; and further integration of CCE’s former North
America business.
In February 2014, the Company announced the expansion of our productivity and reinvestment program to drive incremental
productivity by 2016 that will primarily be redirected into increased media investments. Our incremental productivity goal consists
of two relatively equal components. First, we will expand savings through global supply chain optimization, data and information
technology systems standardization, and resource and cost reallocation. Second, we will increase the effectiveness of our marketing
investments by transforming our marketing and commercial model to redeploy resources into more consumer-facing marketing
investments to accelerate growth.
In October 2014, the Company announced that we are further expanding our productivity and reinvestment program through 2019.
The expansion of the productivity initiatives will focus on four key areas: restructuring the Company’s global supply chain, including
manufacturing in North America; implementing zero-based budgeting across the organization; streamlining and simplifying the
Company’s operating model; and further driving increased discipline and efficiency in direct marketing investments.
The Company has incurred total pretax expenses of $1,365 million related to this program since it commenced. These expenses were
recorded in the line item other operating charges in our consolidated statement of income. Refer to Note 19 for the impact these
charges had on our operating segments. Outside services reported in the table below primarily relate to expenses in connection with
legal, outplacement and consulting activities. Other direct costs reported in the table below include, among other items, internal and
external costs associated with the development, communication, administration and implementation of these initiatives; accelerated
depreciation on certain fixed assets; contract termination fees; and relocation costs.