Coca Cola 2014 Annual Report Download - page 133
Download and view the complete annual report
Please find page 133 of the 2014 Coca Cola annual report below. You can navigate through the pages in the report by either clicking on the pages listed below, or by using the keyword search tool below to find specific information within the annual report.-
 1
1 -
2
-
3
-
4
-
5
-
6
-
7
-
8
-
9
-
10
-
11
-
12
-
13
-
14
-
15
-
16
-
17
-
18
-
19
-
20
-
21
-
22
-
23
-
24
-
25
-
26
-
27
-
28
-
29
-
30
-
31
-
32
-
33
-
34
-
35
-
36
-
37
-
38
-
39
-
40
-
41
-
42
-
43
-
44
-
45
-
46
-
47
-
48
-
49
-
50
-
51
-
52
-
53
-
54
-
55
-
56
-
57
-
58
-
59
-
60
-
61
-
62
-
63
-
64
-
65
-
66
-
67
-
68
-
69
-
70
-
71
-
72
-
73
-
74
-
75
-
76
-
77
-
78
-
79
-
80
-
81
-
82
-
83
-
84
-
85
-
86
-
87
-
88
-
89
-
90
-
91
-
92
-
93
-
94
-
95
-
96
-
97
-
98
-
99
-
100
-
101
-
102
-
103
-
104
-
105
-
106
-
107
-
108
-
109
-
110
-
111
-
112
-
113
-
114
-
115
-
116
-
117
-
118
-
119
-
120
-
121
-
122
-
 123
123 -
 124
124 -
 125
125 -
 126
126 -
 127
127 -
 128
128 -
 129
129 -
 130
130 -
 131
131 -
 132
132 -
 133
133 -
 134
134 -
 135
135 -
 136
136 -
 137
137 -
 138
138 -
 139
139 -
 140
140 -
 141
141 -
 142
142 -
 143
143 -
144
-
145
-
146
-
147
-
148
-
149
-
150
-
151
-
152
-
153
-
154
-
155
-
156
-
157
-
158
-
159
-
160
 |
 |

131
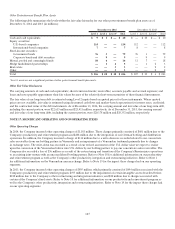
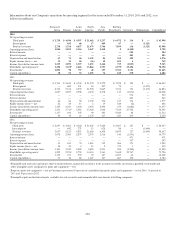
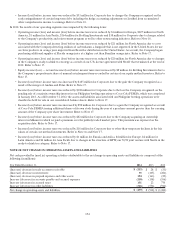
The following table sets forth the percentage of total net operating revenues related to concentrate operations and finished product
operations:
Year Ended December 31, 2014 2013 2012
Concentrate
operations
1
38% 38% 38%
Finished product
operations
2
62 62 62
Net operating revenues 100 % 100 % 100%
1
Includes concentrates sold by the Company to authorized bottling partners for the manufacture of fountain syrups. The bottlers then typically sell the
fountain syrups to wholesalers or directly to fountain retailers.
2
Includes fountain syrups manufactured by the Company, including consolidated bottling operations, and sold to fountain retailers or to authorized
fountain wholesalers or bottling partners who resell the fountain syrups to fountain retailers.
Method of Determining Segment Income or Loss
Management evaluates the performance of our operating segments separately to individually monitor the different factors affecting
financial performance. Our Company manages income taxes and certain treasury-related items, such as interest income and expense,
on a global basis within the Corporate operating segment. We evaluate segment performance based on income or loss before income
taxes.
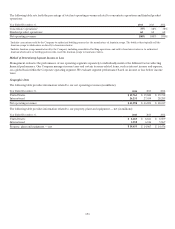
Geographic Data
The following table provides information related to our net operating revenues (in millions):
Year Ended December 31, 2014 2013 2012
United States $ 19,763 $ 19,820 $ 19,732
International 26,235 27,034 28,285
Net operating
revenues
$ 45,998 $ 46,854 $ 48,017
The following table provides information related to our property, plant and equipment — net (in millions):
Year Ended December 31, 2014 2013 2012
United States $ 8,683 $ 8,841 $ 8,509
International 5,950 6,126 5,967
Property, plant and equipment —
net
$ 14,633 $ 14,967 $ 14,476