Electronic Arts 2010 Annual Report Download - page 108
Download and view the complete annual report
Please find page 108 of the 2010 Electronic Arts annual report below. You can navigate through the pages in the report by either clicking on the pages listed below, or by using the keyword search tool below to find specific information within the annual report.-
 1
1 -
2
-
3
-
4
-
5
-
6
-
7
-
8
-
9
-
10
-
11
-
12
-
13
-
14
-
15
-
16
-
17
-
18
-
19
-
20
-
21
-
22
-
23
-
24
-
25
-
26
-
27
-
28
-
29
-
30
-
31
-
32
-
33
-
34
-
35
-
36
-
37
-
38
-
39
-
40
-
41
-
42
-
43
-
44
-
45
-
46
-
47
-
48
-
49
-
50
-
51
-
52
-
53
-
54
-
55
-
56
-
57
-
58
-
59
-
60
-
61
-
62
-
63
-
64
-
65
-
66
-
67
-
68
-
69
-
70
-
71
-
72
-
73
-
74
-
75
-
76
-
77
-
78
-
79
-
80
-
81
-
82
-
83
-
84
-
85
-
86
-
87
-
88
-
89
-
90
-
91
-
92
-
93
-
94
-
95
-
96
-
97
-
 98
98 -
 99
99 -
 100
100 -
 101
101 -
 102
102 -
 103
103 -
 104
104 -
 105
105 -
 106
106 -
 107
107 -
 108
108 -
 109
109 -
 110
110 -
 111
111 -
 112
112 -
 113
113 -
 114
114 -
 115
115 -
 116
116 -
 117
117 -
 118
118 -
119
-
120
-
121
-
122
-
123
-
124
-
125
-
126
-
127
-
128
-
129
-
130
-
131
-
132
-
133
-
134
-
135
-
136
-
137
-
138
-
139
-
140
-
141
-
142
-
143
-
144
-
145
-
146
-
147
-
148
-
149
-
150
-
151
-
152
-
153
-
154
-
155
-
156
-
157
-
158
-
159
-
160
-
161
-
162
-
163
-
164
-
165
-
166
-
167
-
168
-
169
-
170
-
171
-
172
-
173
-
174
-
175
-
176
-
177
-
178
-
179
-
180
-
181
-
182
-
183
-
184
-
185
-
186
-
187
-
188
-
189
-
190
-
191
-
192
-
193
-
194
-
195
-
196
-
197
-
198
-
199
-
200
 |
 |

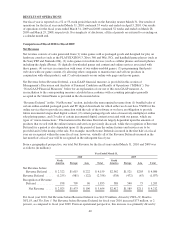
Item 7: Management’s Discussion and Analysis of Financial Condition and Results of Operations
OVERVIEW
The following overview is a top-level discussion of our operating results, as well as some of the trends and
drivers that affect our business. Management believes that an understanding of these trends and drivers is
important in order to understand our results for the fiscal year ended March 31, 2010, as well as our future
prospects. This summary is not intended to be exhaustive, nor is it intended to be a substitute for the detailed
discussion and analysis provided elsewhere in this Form 10-K, including in the “Business” section and the “Risk
Factors” above, the remainder of “Management’s Discussion and Analysis of Financial Condition and Results of
Operations,” or the Consolidated Financial Statements and related notes.
About Electronic Arts
We develop, market, publish and distribute video game software and content that can be played by consumers on
a variety of platforms, including video game consoles (such as the PLAYSTATION®3, Microsoft Xbox 360™
and Nintendo Wii™), personal computers, handheld game players (such as the PlayStation®Portable (“PSP™”)
and the Nintendo DS™) and mobile devices (such as cellular phones and smart phones including the Apple
iPhone™). Some of our games are based on content that we license from others (e.g., FIFA Soccer, Madden NFL
Football, Harry Potter™, and Hasbro’s toy and game intellectual properties), and some of our games are based
on our own wholly-owned intellectual property (e.g., The Sims™, Need for Speed™, and Dead Space™). Our
goal is to publish titles with global mass-market appeal, which often means translating and localizing them for
sale in non-English speaking countries. In addition, we also attempt to create software game “franchises” that
allow us to publish new titles on a recurring basis that are based on the same property. Examples of this franchise
approach are the annual iterations of our sports-based products (e.g., FIFA Soccer, Madden NFL Football, and
NCAA®Football), wholly-owned properties that can be successfully sequeled (e.g., The Sims, Need for Speed
and Battlefield) and titles based on long-lived literary and/or movie properties (e.g., Harry Potter).
Financial Results
Total net revenue for the fiscal year ended March 31, 2010 was $3,654 million, down $558 million as compared
to the fiscal year ended March 31, 2009. At March 31, 2010, deferred net revenue associated with sales of online-
enabled packaged goods and digital content increased by $505 million as compared to March 31, 2009, directly
reducing the amount of reported net revenue during the year ended March 31, 2010. At March 31, 2009, deferred
net revenue associated with sales of online-enabled packaged goods and digital content decreased by $126
million as compared to March 31, 2008, directly increasing the amount of reported net revenue during the year
ended March 31, 2009. Without these changes in deferred net revenue, reported net revenue increased by
approximately $73 million during fiscal year 2010 as compared to fiscal year 2009. Net revenue for fiscal year
2010 was driven by FIFA 10, Madden NFL 10 and The Sims 3.
Net loss for the fiscal year ended March 31, 2010 was $677 million as compared to a net loss of $1,088 million
for the fiscal year ended March 31, 2009. Diluted loss per share for the fiscal year ended March 31, 2010 was
$2.08 as compared to a diluted loss per share of $3.40 for the fiscal year ended March 31, 2009. Net loss
decreased for fiscal year 2010 as compared to fiscal year 2009 primarily as a result of (1) the recognition of $368
million of goodwill impairment during the fiscal year ended March 31, 2009, (2) a $262 million decrease in our
income tax provision primarily due to the discrete tax charge to establish the valuation allowance against our
deferred tax assets in 2009, (3) a $261 million decrease in cost of goods sold, and (4) a $130 million decrease in
research and development costs. These decreases were partially offset by (1) a decrease of $558 million in net
revenue and (2) a $60 million increase in restructuring charges primarily from our fiscal 2010 restructuring.
During fiscal year 2010, we generated $152 million of cash from operating activities as compared to generating
$12 million for fiscal year 2009. The increase in cash provided by operating activities for fiscal year 2010 as
compared to fiscal year 2009 was primarily due to decreases in personnel-related costs and external development
and contracted services as part of our cost reduction initiatives, as well as a reduction in incentive-based
compensation payments.
30