Electronic Arts 2010 Annual Report Download - page 126
Download and view the complete annual report
Please find page 126 of the 2010 Electronic Arts annual report below. You can navigate through the pages in the report by either clicking on the pages listed below, or by using the keyword search tool below to find specific information within the annual report.-
 1
1 -
2
-
3
-
4
-
5
-
6
-
7
-
8
-
9
-
10
-
11
-
12
-
13
-
14
-
15
-
16
-
17
-
18
-
19
-
20
-
21
-
22
-
23
-
24
-
25
-
26
-
27
-
28
-
29
-
30
-
31
-
32
-
33
-
34
-
35
-
36
-
37
-
38
-
39
-
40
-
41
-
42
-
43
-
44
-
45
-
46
-
47
-
48
-
49
-
50
-
51
-
52
-
53
-
54
-
55
-
56
-
57
-
58
-
59
-
60
-
61
-
62
-
63
-
64
-
65
-
66
-
67
-
68
-
69
-
70
-
71
-
72
-
73
-
74
-
75
-
76
-
77
-
78
-
79
-
80
-
81
-
82
-
83
-
84
-
85
-
86
-
87
-
88
-
89
-
90
-
91
-
92
-
93
-
94
-
95
-
96
-
97
-
98
-
99
-
100
-
101
-
102
-
103
-
104
-
105
-
106
-
107
-
108
-
109
-
110
-
111
-
112
-
113
-
114
-
115
-
 116
116 -
 117
117 -
 118
118 -
 119
119 -
 120
120 -
 121
121 -
 122
122 -
 123
123 -
 124
124 -
 125
125 -
 126
126 -
 127
127 -
 128
128 -
 129
129 -
 130
130 -
 131
131 -
 132
132 -
 133
133 -
 134
134 -
 135
135 -
 136
136 -
137
-
138
-
139
-
140
-
141
-
142
-
143
-
144
-
145
-
146
-
147
-
148
-
149
-
150
-
151
-
152
-
153
-
154
-
155
-
156
-
157
-
158
-
159
-
160
-
161
-
162
-
163
-
164
-
165
-
166
-
167
-
168
-
169
-
170
-
171
-
172
-
173
-
174
-
175
-
176
-
177
-
178
-
179
-
180
-
181
-
182
-
183
-
184
-
185
-
186
-
187
-
188
-
189
-
190
-
191
-
192
-
193
-
194
-
195
-
196
-
197
-
198
-
199
-
200
 |
 |

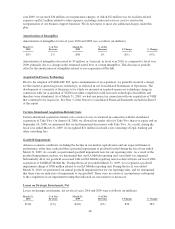
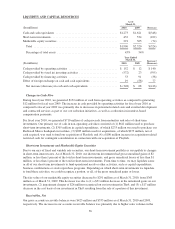
of deferred tax assets. For example, in determining the valuation allowance we recorded at June 30, 2009, we did
not include as a source of future taxable income the taxable temporary difference related to the accumulated tax
depreciation on our headquarters facilities in Redwood City, California. On July 13, 2009, we purchased our
Redwood Shores headquarters facilities concurrent with the expiration and extinguishment of the lessor’s
financing agreements. These facilities were subject to lease obligations to non-affiliated parties which expired in
July 2009, and had been accounted for as operating leases. The total amount paid under the terms of the leases
was $247 million, of which $233 million related to the purchase price of the facilities and $14 million was for the
loss on our lease obligation. Therefore, in the fiscal quarter ended September 30, 2009, we recorded a tax benefit
of approximately $31 million, consisting of approximately $6 million related to the loss on our lease obligation
and a $25 million reduction in our valuation allowance due to the inclusion of a significant portion of the
remaining taxable temporary difference as a source of future taxable income.
The Worker, Homeownership and Business Assistance Act of 2009 (“the Act”) was signed into law on
November 6, 2009. The Act provides that taxpayers may elect to increase the carry back period for tax losses
incurred in a taxable year beginning or ending in either 2008 or 2009. During the fiscal quarter ended
December 31, 2009, we elected to increase the carry back period for tax losses incurred in fiscal year 2009. This
election resulted in a reduction in the valuation allowance on our U.S. deferred tax assets due to an increase in
the sources of taxable income from the extended carry back period. As a result, we recorded a tax benefit of
approximately $28 million in the fiscal quarter ended December 31, 2009 for the reduction in the valuation
allowance.
We historically have considered undistributed earnings of our foreign subsidiaries to be indefinitely reinvested
outside of the United States and, accordingly, no U.S. taxes have been provided thereon. We currently intend to
continue to indefinitely reinvest the undistributed earnings of our foreign subsidiaries outside of the United
States.
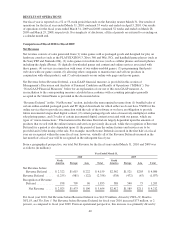
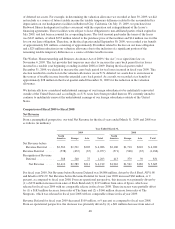
Comparison of Fiscal 2009 to Fiscal 2008
Net Revenue
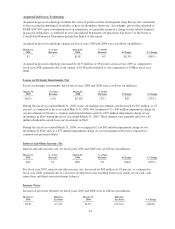
From a geographical perspective, our total Net Revenue for the fiscal years ended March 31, 2009 and 2008 was
as follows (in millions):
Year Ended March 31,
2009 2008
North
America Europe Asia Total
North
America Europe Asia Total
Net Revenue before
Revenue Deferral .... $2,362 $1,521 $203 $ 4,086 $2,100 $1,710 $210 $ 4,020
Revenue Deferral ...... (538) (472) (67) (1,077) (571) (548) (67) (1,186)
Recognition of Revenue
Deferral ............ 588 540 75 1,203 413 379 39 831
Net Revenue ...... $2,412 $1,589 $211 $ 4,212 $1,942 $1,541 $182 $ 3,665
For fiscal year 2009, Net Revenue before Revenue Deferral was $4,086 million, driven by Rock Band, FIFA 09,
and Madden NFL 09. Net Revenue before Revenue Deferral for fiscal year 2009 increased $66 million, or 2
percent, as compared to fiscal year 2008. From an operational perspective, this increase was primarily driven by
(1) a $270 million increase from sales of Rock Band and (2) $115 million from sales of Spore, which was
released in fiscal year 2009 with no comparable release in fiscal year 2008. These increases were partially offset
by (1) a $183 million decrease from sales of The Sims and (2) a $146 million decrease from sales of The
Simpsons, which was released in fiscal year 2008 with no comparable release in fiscal year 2009.
Revenue Deferral for fiscal year 2009 decreased $109 million, or 9 percent, as compared to fiscal year 2008.
From an operational perspective, the decrease was primarily driven by (1) a $61 million decrease from sales of
48