Electronic Arts 2010 Annual Report Download - page 118
Download and view the complete annual report
Please find page 118 of the 2010 Electronic Arts annual report below. You can navigate through the pages in the report by either clicking on the pages listed below, or by using the keyword search tool below to find specific information within the annual report.-
 1
1 -
2
-
3
-
4
-
5
-
6
-
7
-
8
-
9
-
10
-
11
-
12
-
13
-
14
-
15
-
16
-
17
-
18
-
19
-
20
-
21
-
22
-
23
-
24
-
25
-
26
-
27
-
28
-
29
-
30
-
31
-
32
-
33
-
34
-
35
-
36
-
37
-
38
-
39
-
40
-
41
-
42
-
43
-
44
-
45
-
46
-
47
-
48
-
49
-
50
-
51
-
52
-
53
-
54
-
55
-
56
-
57
-
58
-
59
-
60
-
61
-
62
-
63
-
64
-
65
-
66
-
67
-
68
-
69
-
70
-
71
-
72
-
73
-
74
-
75
-
76
-
77
-
78
-
79
-
80
-
81
-
82
-
83
-
84
-
85
-
86
-
87
-
88
-
89
-
90
-
91
-
92
-
93
-
94
-
95
-
96
-
97
-
98
-
99
-
100
-
101
-
102
-
103
-
104
-
105
-
106
-
107
-
 108
108 -
 109
109 -
 110
110 -
 111
111 -
 112
112 -
 113
113 -
 114
114 -
 115
115 -
 116
116 -
 117
117 -
 118
118 -
 119
119 -
 120
120 -
 121
121 -
 122
122 -
 123
123 -
 124
124 -
 125
125 -
 126
126 -
 127
127 -
 128
128 -
129
-
130
-
131
-
132
-
133
-
134
-
135
-
136
-
137
-
138
-
139
-
140
-
141
-
142
-
143
-
144
-
145
-
146
-
147
-
148
-
149
-
150
-
151
-
152
-
153
-
154
-
155
-
156
-
157
-
158
-
159
-
160
-
161
-
162
-
163
-
164
-
165
-
166
-
167
-
168
-
169
-
170
-
171
-
172
-
173
-
174
-
175
-
176
-
177
-
178
-
179
-
180
-
181
-
182
-
183
-
184
-
185
-
186
-
187
-
188
-
189
-
190
-
191
-
192
-
193
-
194
-
195
-
196
-
197
-
198
-
199
-
200
 |
 |

RESULTS OF OPERATIONS
Our fiscal year is reported on a 52 or 53-week period that ends on the Saturday nearest March 31. Our results of
operations for the fiscal year ended March 31, 2010 contained 53 weeks and ended on April 3, 2010. Our results
of operations for the fiscal years ended March 31, 2009 and 2008 contained 52 weeks and ended on March 28,
2009 and March 29, 2008, respectively. For simplicity of disclosure, all fiscal periods are referred to as ending on
a calendar month end.
Comparison of Fiscal 2010 to Fiscal 2009
Net Revenue
Net revenue consists of sales generated from (1) video games sold as packaged goods and designed for play on
hardware consoles (such as the PLAYSTATION 3, Xbox 360 and Wii), PCs, and handheld game players (such as
the Sony PSP and Nintendo DS), (2) video games for mobile devices (such as cellular phones and smart phones
including the Apple iPhone), (3) digitally downloaded games and content and online services associated with
these games, (4) services in connection with some of our online-enabled games, (5) programming third-party
web sites with our game content, (6) allowing other companies to manufacture and sell our products in
conjunction with other products, and (7) advertisements on our online web pages and in our games.
Net Revenue before Revenue Deferral, a non-GAAP financial measure, is provided in this section of
Management’s Discussion and Analysis of Financial Condition and Results of Operations (“MD&A”). See
“Non-GAAP Financial Measures” below for an explanation of our use of this non-GAAP measure. A
reconciliation to the corresponding measure calculated in accordance with accounting principles generally
accepted in the United States is provided in the discussion below.
“Revenue Deferral” in this “Net Revenue” section, includes the unrecognized revenue from (1) bundled sales of
certain online-enabled packaged goods and PC digital downloads for which either we do not have VSOE for the
online service that we provide in connection with the sale of the software or we have an obligation to provide
future incremental unspecified digital content, (2) certain packaged goods sales of massively-multiplayer online
role-playing games, and (3) sales of certain incremental digital content associated with our games, which are
types of “micro-transactions.” Fluctuations in the Revenue Deferral are largely dependent upon the amounts of
products that we sell with the online features and services previously discussed, while the recognition of Revenue
Deferral for a period is also dependent upon (1) the period of time the online features and services are to be
provided and (2) the timing of the sale. For example, most Revenue Deferrals incurred in the first half of a fiscal
year are recognized within the same fiscal year; however, virtually all of the Revenue Deferrals incurred in the
last month of a fiscal year will be recognized in the subsequent fiscal year.
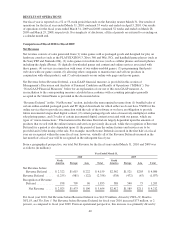
From a geographical perspective, our total Net Revenue for the fiscal years ended March 31, 2010 and 2009 was
as follows (in millions):
Year Ended March 31,
2010 2009
North
America Europe Asia Total
North
America Europe Asia Total
Net Revenue before
Revenue Deferral . . . $ 2,322 $1,615 $ 222 $ 4,159 $2,362 $1,521 $203 $ 4,086
Revenue Deferral ..... (1,255) (981) (122) (2,358) (538) (472) (67) (1,077)
Recognition of Revenue
Deferral ........... 958 799 96 1,853 588 540 75 1,203
Net Revenue ..... $2,025 $1,433 $ 196 $ 3,654 $2,412 $1,589 $211 $ 4,212
For fiscal year 2010, Net Revenue before Revenue Deferral was $4,159 million, driven by FIFA 10,Madden
NFL 10, and The Sims 3. Net Revenue before Revenue Deferral for fiscal year 2010 increased $73 million, or 2
percent, as compared to fiscal year 2009. From an operational perspective, this increase was primarily driven by
40