Electronic Arts 2010 Annual Report Download - page 51
Download and view the complete annual report
Please find page 51 of the 2010 Electronic Arts annual report below. You can navigate through the pages in the report by either clicking on the pages listed below, or by using the keyword search tool below to find specific information within the annual report.-
 1
1 -
2
-
3
-
4
-
5
-
6
-
7
-
8
-
9
-
10
-
11
-
12
-
13
-
14
-
15
-
16
-
17
-
18
-
19
-
20
-
21
-
22
-
23
-
24
-
25
-
26
-
27
-
28
-
29
-
30
-
31
-
32
-
33
-
34
-
35
-
36
-
37
-
38
-
39
-
40
-
 41
41 -
 42
42 -
 43
43 -
 44
44 -
 45
45 -
 46
46 -
 47
47 -
 48
48 -
 49
49 -
 50
50 -
 51
51 -
 52
52 -
 53
53 -
 54
54 -
 55
55 -
 56
56 -
 57
57 -
 58
58 -
 59
59 -
 60
60 -
 61
61 -
62
-
63
-
64
-
65
-
66
-
67
-
68
-
69
-
70
-
71
-
72
-
73
-
74
-
75
-
76
-
77
-
78
-
79
-
80
-
81
-
82
-
83
-
84
-
85
-
86
-
87
-
88
-
89
-
90
-
91
-
92
-
93
-
94
-
95
-
96
-
97
-
98
-
99
-
100
-
101
-
102
-
103
-
104
-
105
-
106
-
107
-
108
-
109
-
110
-
111
-
112
-
113
-
114
-
115
-
116
-
117
-
118
-
119
-
120
-
121
-
122
-
123
-
124
-
125
-
126
-
127
-
128
-
129
-
130
-
131
-
132
-
133
-
134
-
135
-
136
-
137
-
138
-
139
-
140
-
141
-
142
-
143
-
144
-
145
-
146
-
147
-
148
-
149
-
150
-
151
-
152
-
153
-
154
-
155
-
156
-
157
-
158
-
159
-
160
-
161
-
162
-
163
-
164
-
165
-
166
-
167
-
168
-
169
-
170
-
171
-
172
-
173
-
174
-
175
-
176
-
177
-
178
-
179
-
180
-
181
-
182
-
183
-
184
-
185
-
186
-
187
-
188
-
189
-
190
-
191
-
192
-
193
-
194
-
195
-
196
-
197
-
198
-
199
-
200
 |
 |

Proxy Statement
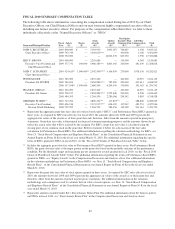
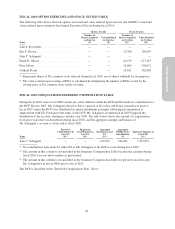
All Other Compensation Table
(5)
Name
Fiscal
Year
Basic Group
Term Life and
Disability
Premiums and
Executive
Physical Fees
($)
Company-
matching
401(k)
Contributions
($)(A)
Relocation-
Related
Costs
($)
Tax Gross-up
Related to
Relocation
Costs
($)
Other
($)
Total
($)
JOHN S. RICCITIELLO ....... 2010 1,308 — — — — 1,308
2009 1,308 — — — — 1,308
2008 3,958 — — — — 3,958
ERIC F. BROWN ............ 2010 3,645 — — 360(B) — 4,005
2009 1,199 — 420,459(C) 59,801 — 481,459
JOHN C. SCHAPPERT ....... 2010 872 1,038 1,240,436(D) 736,210(E) — 1,978,556
PETER MOORE ............. 2010 3,569 7,350 — — — 10,919
2009 4,114 6,900 287,941(F) 194,656 — 493,611
2008 3,766 1,310 139,390(G) 46,917 — 191,383
FRANK D. GIBEAU ......... 2010 3,569 7,350 — — — 10,919
2009 1,308 6,900 — — — 8,208
2008 3,135 6,750 — — — 9,885
GERHARD FLORIN ......... 2010 — 134,247(H) 118,067(I) 98,144 38,348(J) 388,806
2009 — 120,737(H) 189,997 136,502 36,015(J) 483,251
2008 — 135,556(H) 234,398 101,667 29,440(J) 501,061
(A) Except for Dr. Florin, amounts shown reflect company-matching 401(k) contributions for fiscal 2008, 2009 and 2010 that were each
paid during the subsequent fiscal year. Refer to footnote (H) below for a description of contributions made for Dr. Florin. The
contributions previously reported for Messrs. Moore and Gibeau for fiscal 2008 and 2009 were matching contributions for fiscal
2007 and 2008. These amounts now reflect the contributions made for fiscal 2008 and 2009 and differ by immaterial amounts from
those previously reported.
(B) Includes tax gross-up related to relocation costs incurred in fiscal 2009.
(C) Relocation-related costs for Mr. Brown in fiscal 2009 include costs of a house-hunting trip, temporary housing, home sale costs,
home purchase costs, storage, shipping of household goods and a miscellaneous relocation allowance for fiscal 2009.
(D) Relocation-related compensation was provided to Mr. Schappert in fiscal 2010 as an incentive for him to join the Company and to
reimburse him for the costs resulting from that decision, including costs for a house-hunting trip, temporary housing, home sale
costs, home purchase costs, shipping of household goods and a miscellaneous relocation allowance. These costs include payments
related to the loss in value resulting from the sale of his home, measured as the difference between the original purchase price of the
home and the fair market value, assessed using independent appraisals, immediately prior to marketing the home for sale.
(E) Includes tax gross-up related to the loss on the sale of Mr. Schappert’s former home of $649,287.
(F) Relocation-related costs for Mr. Moore in fiscal 2009 include costs of a house-hunting trip, temporary housing, home sale costs,
home purchase costs, storage, shipping of household goods and a miscellaneous relocation allowance.
(G) Relocation-related costs for Mr. Moore in fiscal 2008 include costs of a house-hunting trip, temporary housing, home sale costs,
storage and shipping of household goods.
(H) Amounts shown reflect company contributions to a defined contribution pension plan for which all employees in Switzerland are
eligible. Life and long-term disability coverage are also included in the pension plan.
(I) Relocation-related costs for Dr. Florin in fiscal 2010 reflect international reassignment expenses including housing allowances, tax
preparation assistance costs, language training and dependent education costs.
(J) Other costs for Dr. Florin include an automobile and fuel allowance for which all senior employees and members of management
residing in Switzerland are generally eligible, a child allowance paid to all employees in Switzerland by the state directly to the
employee, company-paid medical, accident and life insurance premiums and related benefits.
(6)
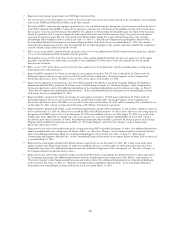
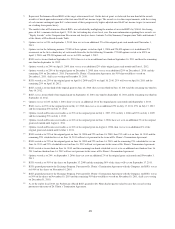
Represents the aggregate grant-date fair value of the target payout of Performance-Based RSUs granted to Mr. Riccitiello in
fiscal 2009 of $3,306,633, based on the probable outcome of the performance condition. At the time the Performance-Based
RSUs were granted, we believed that the threshold target (one-third of the maximum award of 200,000 RSUs) was probable
with vesting based upon the achievement of the first non-GAAP net income target. Assuming the highest level of performance
condition is achieved, the maximum grant-date fair value for the Performance-Based RSUs would be $9,920,000.
(7)
Represents the aggregate grant-date fair value of 83,300 time-based RSUs granted to Mr. Brown during fiscal 2009 of
$4,333,266; and the aggregate grant-date fair value of the target payout of the Performance-Based RSUs granted to Mr. Brown
in fiscal 2009 of $1,653,317, based on the probable outcome of the performance condition. At the time the Performance-Based
RSUs were granted, we believed that the threshold target (one-third of the maximum award of 100,000 RSUs) was probable
with vesting based upon the achievement of the first non-GAAP net income target. Assuming the highest level of performance
condition is achieved, the maximum grant-date fair value for the Performance-Based RSUs would be $4,960,000.
43