Electronic Arts 2010 Annual Report Download - page 110
Download and view the complete annual report
Please find page 110 of the 2010 Electronic Arts annual report below. You can navigate through the pages in the report by either clicking on the pages listed below, or by using the keyword search tool below to find specific information within the annual report.-
 1
1 -
2
-
3
-
4
-
5
-
6
-
7
-
8
-
9
-
10
-
11
-
12
-
13
-
14
-
15
-
16
-
17
-
18
-
19
-
20
-
21
-
22
-
23
-
24
-
25
-
26
-
27
-
28
-
29
-
30
-
31
-
32
-
33
-
34
-
35
-
36
-
37
-
38
-
39
-
40
-
41
-
42
-
43
-
44
-
45
-
46
-
47
-
48
-
49
-
50
-
51
-
52
-
53
-
54
-
55
-
56
-
57
-
58
-
59
-
60
-
61
-
62
-
63
-
64
-
65
-
66
-
67
-
68
-
69
-
70
-
71
-
72
-
73
-
74
-
75
-
76
-
77
-
78
-
79
-
80
-
81
-
82
-
83
-
84
-
85
-
86
-
87
-
88
-
89
-
90
-
91
-
92
-
93
-
94
-
95
-
96
-
97
-
98
-
99
-
 100
100 -
 101
101 -
 102
102 -
 103
103 -
 104
104 -
 105
105 -
 106
106 -
 107
107 -
 108
108 -
 109
109 -
 110
110 -
 111
111 -
 112
112 -
 113
113 -
 114
114 -
 115
115 -
 116
116 -
 117
117 -
 118
118 -
 119
119 -
 120
120 -
121
-
122
-
123
-
124
-
125
-
126
-
127
-
128
-
129
-
130
-
131
-
132
-
133
-
134
-
135
-
136
-
137
-
138
-
139
-
140
-
141
-
142
-
143
-
144
-
145
-
146
-
147
-
148
-
149
-
150
-
151
-
152
-
153
-
154
-
155
-
156
-
157
-
158
-
159
-
160
-
161
-
162
-
163
-
164
-
165
-
166
-
167
-
168
-
169
-
170
-
171
-
172
-
173
-
174
-
175
-
176
-
177
-
178
-
179
-
180
-
181
-
182
-
183
-
184
-
185
-
186
-
187
-
188
-
189
-
190
-
191
-
192
-
193
-
194
-
195
-
196
-
197
-
198
-
199
-
200
 |
 |
Recent Developments
Acquisition of Playfish Limited. On November 9, 2009, we acquired all of the outstanding shares of Playfish
Limited (“Playfish™”) for an aggregate purchase price of approximately $308 million in cash and equity. In
addition, we may be required to pay additional variable cash consideration that is contingent upon the
achievement of certain performance milestones through December 31, 2011. This additional consideration is
limited to a maximum of $100 million. Playfish is a developer of free-to-play social games that can be played on
social networking platforms.
Fiscal 2010 Restructuring Plan. In fiscal year 2010, we announced details of a restructuring plan. This plan
includes a narrowing of our product portfolio to provide greater focus on titles with higher margin opportunities.
Under this plan, we reduced our workforce by approximately 1,200 employees and have been (1) consolidating
or closing various facilities, (2) eliminating certain titles, and (3) incurring IT and other costs to assist in
reorganizing certain activities. The majority of these actions were completed by March 31, 2010.
Since the inception of this plan through March 31, 2010, we have incurred charges of approximately $116
million. Overall, including charges incurred through March 31, 2010, we expect to incur total cash and non-cash
charges between $140 million and $145 million by March 31, 2012. These charges consist primarily of
(1) employee-related costs (approximately $65 million), (2) intangible asset impairment costs, abandoned rights
to intellectual property costs, and other costs to assist in the reorganization of our business support functions
(approximately $35 million), (3) facilities exit costs (approximately $25 million), and (4) other reorganizational
costs including IT and consulting costs (approximately $20 million).
Employee Stock Option Exchange Program. On October 21, 2009, we launched a voluntary Employee Stock
Option Exchange Program (“Exchange Program”) to permit our eligible employees to exchange outstanding
eligible options for a lesser number of restricted stock units, shares of restricted stock (in Canada only), or new
options (in China only) to be granted under our 2000 Equity Incentive Plan (the “Equity Plan”). The Exchange
Program offer period began on October 21, 2009 and ended on November 18, 2009.
Options eligible for the Exchange Program were those options granted prior to October 21, 2008, that had an
exercise price per share greater than $28.18, which was the 52-week high trading price of our common stock
measured as of the start date of the Exchange Program, as reported on the NASDAQ Global Select Market, and
that upon conversion using the exchange ratio applicable for such options resulted in four or more shares of
restricted stock units, shares of restricted stock or new options, as the case may be.
The Exchange Program resulted in options to purchase approximately 16,561,000 shares of our common stock
being exchanged for restricted stock units to acquire approximately 4,996,000 shares, approximately 923,000
shares of restricted stock awards and new options to purchase approximately 18,000 shares.
Due to the structure of the Exchange Program as a “value-for-value” exchange for the eligible options tendered
for exchange, and certain assumptions we are required to use regarding the eligible options for accounting
purposes, we will recognize an incremental accounting charge of approximately $70 million over the vesting
period of the restricted stock units, restricted stock and options issued in the Exchange Program in addition to
recognizing any remaining unrecognized expense for the stock options surrendered in the exchange.
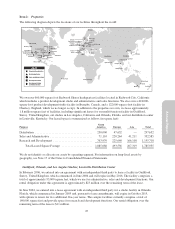
International Operations and Foreign Currency Exchange Impact. International sales (i.e., revenue derived
from countries other than Canada and the United States), are a fundamental part of our business. Net revenue
from international sales accounted for approximately 45 percent of our total net revenue during fiscal year 2010
and approximately 43 percent of our total net revenue during fiscal year 2009. We believe that in order to
succeed internationally, it is important to locally develop content that is specifically directed toward local
cultures and customs. Year-over-year, we estimate that foreign exchange rates had an unfavorable impact on our
net revenue of approximately $107 million, or 3 percent, for the fiscal year ended March 31, 2010. During the
fiscal year ended March 31, 2010, the U.S. dollar strengthened against other currencies, including the Euro and
the British pound sterling. In addition, our international investments and our cash and cash equivalents
32