Electronic Arts 2010 Annual Report Download - page 134
Download and view the complete annual report
Please find page 134 of the 2010 Electronic Arts annual report below. You can navigate through the pages in the report by either clicking on the pages listed below, or by using the keyword search tool below to find specific information within the annual report.-
 1
1 -
2
-
3
-
4
-
5
-
6
-
7
-
8
-
9
-
10
-
11
-
12
-
13
-
14
-
15
-
16
-
17
-
18
-
19
-
20
-
21
-
22
-
23
-
24
-
25
-
26
-
27
-
28
-
29
-
30
-
31
-
32
-
33
-
34
-
35
-
36
-
37
-
38
-
39
-
40
-
41
-
42
-
43
-
44
-
45
-
46
-
47
-
48
-
49
-
50
-
51
-
52
-
53
-
54
-
55
-
56
-
57
-
58
-
59
-
60
-
61
-
62
-
63
-
64
-
65
-
66
-
67
-
68
-
69
-
70
-
71
-
72
-
73
-
74
-
75
-
76
-
77
-
78
-
79
-
80
-
81
-
82
-
83
-
84
-
85
-
86
-
87
-
88
-
89
-
90
-
91
-
92
-
93
-
94
-
95
-
96
-
97
-
98
-
99
-
100
-
101
-
102
-
103
-
104
-
105
-
106
-
107
-
108
-
109
-
110
-
111
-
112
-
113
-
114
-
115
-
116
-
117
-
118
-
119
-
120
-
121
-
122
-
123
-
 124
124 -
 125
125 -
 126
126 -
 127
127 -
 128
128 -
 129
129 -
 130
130 -
 131
131 -
 132
132 -
 133
133 -
 134
134 -
 135
135 -
 136
136 -
 137
137 -
 138
138 -
 139
139 -
 140
140 -
 141
141 -
 142
142 -
 143
143 -
 144
144 -
145
-
146
-
147
-
148
-
149
-
150
-
151
-
152
-
153
-
154
-
155
-
156
-
157
-
158
-
159
-
160
-
161
-
162
-
163
-
164
-
165
-
166
-
167
-
168
-
169
-
170
-
171
-
172
-
173
-
174
-
175
-
176
-
177
-
178
-
179
-
180
-
181
-
182
-
183
-
184
-
185
-
186
-
187
-
188
-
189
-
190
-
191
-
192
-
193
-
194
-
195
-
196
-
197
-
198
-
199
-
200
 |
 |

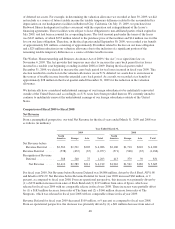
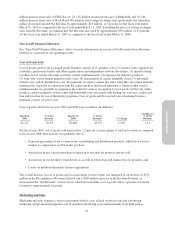
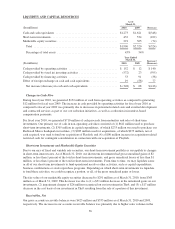
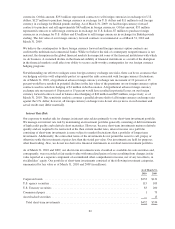
LIQUIDITY AND CAPITAL RESOURCES
As of
March 31,
Decrease(In millions) 2010 2009
Cash and cash equivalents .......................................... $1,273 $1,621 $(348)
Short-term investments ............................................. 432 534 (102)
Marketable equity securities ......................................... 291 365 (74)
Total ......................................................... $1,996 $2,520 $(524)
Percentage of total assets ......................................... 43% 54%
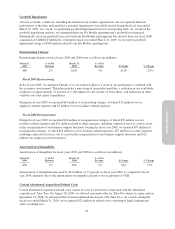
Year Ended
March 31, Increase /
(Decrease)(In millions) 2010 2009
Cash provided by operating activities ................................. $ 152 $ 12 $140
Cash provided by (used in) investing activities .......................... (572) 23 (595)
Cash provided by financing activities ................................. 53 91 (38)
Effect of foreign exchange on cash and cash equivalents .................. 19 (58) 77
Net increase (decrease) in cash and cash equivalents ................... $ (348) $ 68 $(416)
Changes in Cash Flow
During fiscal year 2010, we generated $152 million of cash from operating activities as compared to generating
$12 million for fiscal year 2009. The increase in cash provided by operating activities for fiscal year 2010 as
compared to fiscal year 2009 was primarily due to decreases in personnel-related costs and external development
and contracted services as part of our cost reduction initiatives, as well as a reduction in incentive-based
compensation payments.
For fiscal year 2010, we generated $710 million of cash proceeds from maturities and sales of short-term
investments. Our primary use of cash in non-operating activities consisted of (1) $611 million used to purchase
short-term investments, (2) $305 million in capital expenditures, of which $233 million was used to purchase our
Redwood Shores headquarters facilities, (3) $283 million used for acquisitions, of which $275 million, net of
cash acquired, was used to fund our acquisition of Playfish, and (4) a $100 million increase in acquisition-related
restricted cash for contingent consideration in connection with our acquisition of Playfish.
Short-term Investments and Marketable Equity Securities
Due to our mix of fixed and variable rate securities, our short-term investment portfolio is susceptible to changes
in short-term interest rates. As of March 31, 2010, our short-term investments had gross unrealized gains of $2
million, or less than 1 percent of the total in short-term investments, and gross unrealized losses of less than $1
million, or less than 1 percent of the total in short-term investments. From time to time, we may liquidate some
or all of our short-term investments to fund operational needs or other activities, such as capital expenditures,
business combinations or stock repurchase programs. Depending on which short-term investments we liquidate
to fund these activities, we could recognize a portion, or all, of the gross unrealized gains or losses.
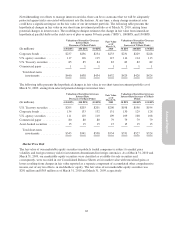
The fair value of our marketable equity securities decreased to $291 million as of March 31, 2010, from $365
million as of March 31, 2009. This decrease was due to (1) a $31 million decrease in the unrealized gains on our
investments, (2) impairment charges of $26 million recognized on our investment in The9, and (3) a $17 million
decrease in the cost basis of our investment in The9 resulting from the sale of a portion of this investment.
Receivables, Net
Our gross accounts receivable balances were $423 million and $333 million as of March 31, 2010 and 2009,
respectively. The increase in our accounts receivable balance was primarily due to higher sales volumes in the
56