Electronic Arts 2010 Annual Report Download - page 53
Download and view the complete annual report
Please find page 53 of the 2010 Electronic Arts annual report below. You can navigate through the pages in the report by either clicking on the pages listed below, or by using the keyword search tool below to find specific information within the annual report.-
 1
1 -
2
-
3
-
4
-
5
-
6
-
7
-
8
-
9
-
10
-
11
-
12
-
13
-
14
-
15
-
16
-
17
-
18
-
19
-
20
-
21
-
22
-
23
-
24
-
25
-
26
-
27
-
28
-
29
-
30
-
31
-
32
-
33
-
34
-
35
-
36
-
37
-
38
-
39
-
40
-
41
-
42
-
 43
43 -
 44
44 -
 45
45 -
 46
46 -
 47
47 -
 48
48 -
 49
49 -
 50
50 -
 51
51 -
 52
52 -
 53
53 -
 54
54 -
 55
55 -
 56
56 -
 57
57 -
 58
58 -
 59
59 -
 60
60 -
 61
61 -
 62
62 -
 63
63 -
64
-
65
-
66
-
67
-
68
-
69
-
70
-
71
-
72
-
73
-
74
-
75
-
76
-
77
-
78
-
79
-
80
-
81
-
82
-
83
-
84
-
85
-
86
-
87
-
88
-
89
-
90
-
91
-
92
-
93
-
94
-
95
-
96
-
97
-
98
-
99
-
100
-
101
-
102
-
103
-
104
-
105
-
106
-
107
-
108
-
109
-
110
-
111
-
112
-
113
-
114
-
115
-
116
-
117
-
118
-
119
-
120
-
121
-
122
-
123
-
124
-
125
-
126
-
127
-
128
-
129
-
130
-
131
-
132
-
133
-
134
-
135
-
136
-
137
-
138
-
139
-
140
-
141
-
142
-
143
-
144
-
145
-
146
-
147
-
148
-
149
-
150
-
151
-
152
-
153
-
154
-
155
-
156
-
157
-
158
-
159
-
160
-
161
-
162
-
163
-
164
-
165
-
166
-
167
-
168
-
169
-
170
-
171
-
172
-
173
-
174
-
175
-
176
-
177
-
178
-
179
-
180
-
181
-
182
-
183
-
184
-
185
-
186
-
187
-
188
-
189
-
190
-
191
-
192
-
193
-
194
-
195
-
196
-
197
-
198
-
199
-
200
 |
 |

Proxy Statement
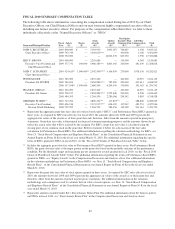
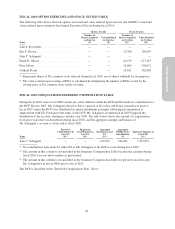
FISCAL 2010 GRANTS OF PLAN-BASED AWARDS TABLE
The following table shows information regarding non-equity incentive and equity plan-based awards granted to the
Named Executive Officers during fiscal 2010.
Name
Grant
Date
(1)
Approval
Date
(1)
Estimated Future Payouts
Under Non-Equity Incentive
Plan Awards
(2)
Estimated Future Payouts
Under Equity Incentive Plan
Awards
(3)
All
Other
Stock
Awards:
Number of
Shares of
Stock or
Units
(#)
(4)
All
Other
Option
Awards:
Number of
Securities
Underlying
Options
(#)
(5)
Exercise
or Base
Price
of
Option
Awards
($/Sh)
(6)
Grant
Date Fair
Value of
Stock
and
Option
Awards
($)
(7)
Threshold
($)
Target
($)
Maximum
($)
Threshold
(#)
Target
(#)
Maximum
(#)
John S.
Riccitiello . . — — — 1,200,000 2,400,000 — — — — — — —
9/16/2009 9/9/2009 — — — — — — 387,000(8) — — 7,294,950
9/16/2009 9/9/2009 — — — — — — — 139,000(9) 18.85 1,002,287
Eric F.
Brown ..... — — — 450,000 1,800,000 — — — — — — —
6/16/2009 5/6/2009 — — — — — — 15,225(8) — — 316,680
9/16/2009 8/26/2009 — — — — — — 100,000(8) — — 1,885,000
John C.
Schappert . . — — — 450,000 1,800,000 — — — — — — —
7/16/2009 6/9/2009 — — — 41,667 41,667 125,000 — — — 893,750
7/16/2009 6/9/2009 — — — — — 75,000(10) — — 1,608,750
7/16/2009 6/9/2009 — — — — — — — 500,000(9) 21.45 4,106,950
Frank D.
Gibeau..... — — — 545,000 1,635,000 — — — — — — —
6/16/2009 5/6/2009 — — — — — — 19,000(8) — — 395,200
9/16/2009 8/26/2009 — — — — — — 120,000(8) — — 2,262,000
Peter Moore . . . — — — 565,000 1,695,000 — — — — — — —
6/16/2009 5/6/2009 — — — — — — 19,000(8) — — 395,200
9/16/2009 8/26/2009 — — — — — — 120,000(8) — — 2,262,000
Gerhard
Florin ..... 6/16/2009 5/6/2009 — — — — — — 9,000(8) — — 187,200
11/19/2009 7/29/2009 — — — — — — 129,505(11) — — 1,428,246(12)
11/19/2009 7/29/2009 — — — — — — 49,871(13) — — 561,871(12)
11/19/2009 7/29/2009 — — — — — — 154,441(14) — — 2,691,907(15)
11/19/2009 11/19/2009 — — — — — — — 25,000(16) 16.06 117,825(17)
(1) Each grant was approved on the approval date indicated above by our Compensation Committee for grant on the specific grant date indicated
above. For more information regarding our grant date policy, see “Equity Awards Grant Practices” in the Compensation Discussion and
Analysis above.
(2) The amounts shown represent the target and maximum amount of potential cash bonus plan awards provided for under the Electronic Arts
Executive Bonus Plan. During fiscal 2010 the Compensation Committee increased the target bonus opportunity for Messrs. Riccitiello, Gibeau
and Moore, as described above under “Annual Cash Bonus” in the Compensation Discussion and Analysis. Amounts shown represent each
NEO’s target bonus opportunity as of the end of fiscal 2010. The target amounts are pre-established as a percentage of salary and the maximum
amounts represent the greatest payout, which could have been made if the pre-established performance level was met or exceeded. For fiscal
2010, EA did not achieve the minimum funding requirement under the Executive Bonus Plan and the discretionary bonus payments were made
to the NEOs pursuant to the Discretionary Bonus Plan. Actual 2010 payouts to the NEOs under the Discretionary Bonus Plan are reflected in the
Non-Equity Incentive Plan Compensation column of the Summary Compensation Table above. For more information regarding the bonuses paid
to our NEOs in fiscal 2010, see “Annual Cash Bonus” in the Compensation Discussion and Analysis above.
(3) The amounts shown reflect the threshold, target and maximum number of Performance-Based RSUs granted under our 2000 Equity Incentive
Plan. The threshold and target amounts are one-third of the maximum amount. The award vests in three equal amounts contingent upon EA’s
achievement of one of three progressively higher adjusted non-GAAP net income targets (as measured on a trailing four-quarter basis). If EA
does not achieve one or more of the net income targets by June 30, 2013, the portion of the award that would have vested upon achievement of
the target will be cancelled. For more information regarding these awards, see “Equity Awards” in the Compensation Discussion and Analysis
above.
(4) Represents awards of RSUs granted under our 2000 Equity Incentive Plan. Upon vesting, each restricted stock unit automatically converts into
one share of EA common stock, and does not have an exercise price or expiration date. The RSUs are not entitled to receive dividends, if any,
paid by EA on its common stock.
45