Electronic Arts 2010 Annual Report Download - page 183
Download and view the complete annual report
Please find page 183 of the 2010 Electronic Arts annual report below. You can navigate through the pages in the report by either clicking on the pages listed below, or by using the keyword search tool below to find specific information within the annual report.-
 1
1 -
2
-
3
-
4
-
5
-
6
-
7
-
8
-
9
-
10
-
11
-
12
-
13
-
14
-
15
-
16
-
17
-
18
-
19
-
20
-
21
-
22
-
23
-
24
-
25
-
26
-
27
-
28
-
29
-
30
-
31
-
32
-
33
-
34
-
35
-
36
-
37
-
38
-
39
-
40
-
41
-
42
-
43
-
44
-
45
-
46
-
47
-
48
-
49
-
50
-
51
-
52
-
53
-
54
-
55
-
56
-
57
-
58
-
59
-
60
-
61
-
62
-
63
-
64
-
65
-
66
-
67
-
68
-
69
-
70
-
71
-
72
-
73
-
74
-
75
-
76
-
77
-
78
-
79
-
80
-
81
-
82
-
83
-
84
-
85
-
86
-
87
-
88
-
89
-
90
-
91
-
92
-
93
-
94
-
95
-
96
-
97
-
98
-
99
-
100
-
101
-
102
-
103
-
104
-
105
-
106
-
107
-
108
-
109
-
110
-
111
-
112
-
113
-
114
-
115
-
116
-
117
-
118
-
119
-
120
-
121
-
122
-
123
-
124
-
125
-
126
-
127
-
128
-
129
-
130
-
131
-
132
-
133
-
134
-
135
-
136
-
137
-
138
-
139
-
140
-
141
-
142
-
143
-
144
-
145
-
146
-
147
-
148
-
149
-
150
-
151
-
152
-
153
-
154
-
155
-
156
-
157
-
158
-
159
-
160
-
161
-
162
-
163
-
164
-
165
-
166
-
167
-
168
-
169
-
170
-
171
-
172
-
 173
173 -
 174
174 -
 175
175 -
 176
176 -
 177
177 -
 178
178 -
 179
179 -
 180
180 -
 181
181 -
 182
182 -
 183
183 -
 184
184 -
 185
185 -
 186
186 -
 187
187 -
 188
188 -
 189
189 -
 190
190 -
 191
191 -
 192
192 -
 193
193 -
194
-
195
-
196
-
197
-
198
-
199
-
200
 |
 |

Annual Report
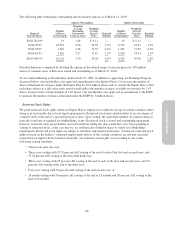
(16) NET LOSS PER SHARE
Basic earnings per share is computed as net loss divided by the weighted-average number of common shares
outstanding for the period. Diluted earnings per share reflects the potential dilution that could occur from
common shares issuable through stock-based compensation plans including stock options, restricted stock,
restricted stock units, common stock through our ESPP, warrants and other convertible securities using the
treasury stock method.
As a result of our net loss for the fiscal years ended March 31, 2010, 2009 and 2008, we have excluded certain
equity-based instruments from the diluted loss per share calculation as their inclusion would have had an
antidilutive effect. Had we reported net income for these periods, an additional 2 million shares, 4 million shares
and 7 million shares of common stock would have been included in the number of shares used to calculate
diluted earnings per share for the fiscal years ended March 31, 2010, 2009 and 2008, respectively. Options to
purchase and restricted stock units and restricted stock to be released in the amount of 32 million shares,
28 million shares and 18 million shares of common stock were excluded from the computation of diluted shares
for the fiscal years ended March 31, 2010, 2009 and 2008, respectively, as their inclusion would have had an
antidilutive effect. For fiscal years 2010, 2009 and 2008, the weighted-average exercise prices of these shares
were $32.89, $44.59 and $53.89 per share, respectively.
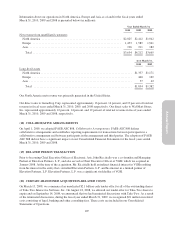
(17) SEGMENT INFORMATION
Our reporting segments are based upon: our internal organizational structure; the manner in which our operations
are managed; the criteria used by our Chief Executive Officer, our Chief Operating Decision Maker (“CODM”),
to evaluate segment performance; the availability of separate financial information; and overall materiality
considerations.
Our business is currently organized around three operating labels, EA Games, EA SPORTS and EA Play, as well
as EA Interactive, which reports into our Publishing Organization. Our CODM regularly receives separate
financial information for distinct businesses within the EA Interactive organization, including EA Mobile, Pogo
and Playfish. Accordingly, in assessing performance and allocating resources, our CODM reviews the results of
our three Labels, as well as the operating segments in EA Interactive, including EA Mobile, Pogo and Playfish.
Due to their similar economic characteristics, products, and distribution methods, EA Games, EA SPORTS, and
EA Play’s results are aggregated into one Reportable Segment (the “Label segment”) as shown below. The
remaining operating segments’ results are not material for separate disclosure and are included in the
reconciliation of Label segment profit to consolidated operating loss below. In addition to assessing performance
and allocating resources based on our operating segments as described herein, to a lesser degree, our CODM also
reviews results based on geographic performance.
105