Electronic Arts 2010 Annual Report Download - page 130
Download and view the complete annual report
Please find page 130 of the 2010 Electronic Arts annual report below. You can navigate through the pages in the report by either clicking on the pages listed below, or by using the keyword search tool below to find specific information within the annual report.-
 1
1 -
2
-
3
-
4
-
5
-
6
-
7
-
8
-
9
-
10
-
11
-
12
-
13
-
14
-
15
-
16
-
17
-
18
-
19
-
20
-
21
-
22
-
23
-
24
-
25
-
26
-
27
-
28
-
29
-
30
-
31
-
32
-
33
-
34
-
35
-
36
-
37
-
38
-
39
-
40
-
41
-
42
-
43
-
44
-
45
-
46
-
47
-
48
-
49
-
50
-
51
-
52
-
53
-
54
-
55
-
56
-
57
-
58
-
59
-
60
-
61
-
62
-
63
-
64
-
65
-
66
-
67
-
68
-
69
-
70
-
71
-
72
-
73
-
74
-
75
-
76
-
77
-
78
-
79
-
80
-
81
-
82
-
83
-
84
-
85
-
86
-
87
-
88
-
89
-
90
-
91
-
92
-
93
-
94
-
95
-
96
-
97
-
98
-
99
-
100
-
101
-
102
-
103
-
104
-
105
-
106
-
107
-
108
-
109
-
110
-
111
-
112
-
113
-
114
-
115
-
116
-
117
-
118
-
119
-
 120
120 -
 121
121 -
 122
122 -
 123
123 -
 124
124 -
 125
125 -
 126
126 -
 127
127 -
 128
128 -
 129
129 -
 130
130 -
 131
131 -
 132
132 -
 133
133 -
 134
134 -
 135
135 -
 136
136 -
 137
137 -
 138
138 -
 139
139 -
 140
140 -
141
-
142
-
143
-
144
-
145
-
146
-
147
-
148
-
149
-
150
-
151
-
152
-
153
-
154
-
155
-
156
-
157
-
158
-
159
-
160
-
161
-
162
-
163
-
164
-
165
-
166
-
167
-
168
-
169
-
170
-
171
-
172
-
173
-
174
-
175
-
176
-
177
-
178
-
179
-
180
-
181
-
182
-
183
-
184
-
185
-
186
-
187
-
188
-
189
-
190
-
191
-
192
-
193
-
194
-
195
-
196
-
197
-
198
-
199
-
200
 |
 |

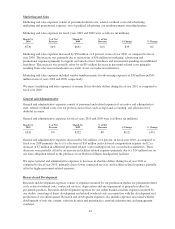
Marketing and sales expenses for fiscal years 2009 and 2008 were as follows (in millions):
March 31,
2009
% of Net
Revenue
March 31,
2008
% of Net
Revenue $ Change % Change
$691 16% $588 16% $103 18%
Marketing and sales expenses increased by $103 million, or 18 percent, in fiscal year 2009, as compared to fiscal
year 2008. The increase was primarily due to (1) an increase of $85 million in marketing, advertising and
promotional expenses primarily to support our launch of new franchises and incremental spending on established
franchises and (2) a $17 million increase in additional personnel-related costs primarily resulting from an
increase in headcount prior to actions taken under our fiscal 2009 restructuring.
Marketing and sales expenses included vendor reimbursements for advertising expenses of $31 million and $54
million in fiscal years 2009 and 2008, respectively.
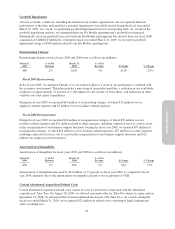
General and Administrative
General and administrative expenses consist of personnel and related expenses of executive and administrative
staff, related overhead costs, fees for professional services such as legal and accounting, and allowances for
doubtful accounts.
General and administrative expenses for fiscal years 2009 and 2008 were as follows (in millions):
March 31,
2009
% of Net
Revenue
March 31,
2008
% of Net
Revenue $ Change % Change
$332 8% $339 9% $(7) (2%)
General and administrative expenses decreased by $7 million, or 2 percent, in fiscal year 2009, as compared to
fiscal year 2008 primarily due to a decrease in facilities-related expenses of $14 million, partially offset by an
increase of $9 million in stock-based compensation expense.
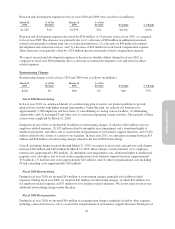
Research and Development
Research and development expenses consist of expenses incurred by our production studios for personnel-related
costs, related overhead costs, contracted services, depreciation and any impairment of prepaid royalties for
pre-launch products. Research and development expenses for our online business include expenses incurred by
our studios consisting of direct development and related overhead costs in connection with the development and
production of our online games. Research and development expenses also include expenses associated with the
development of web site content, software licenses and maintenance, network infrastructure and management
overhead.
Research and development expenses for fiscal years 2009 and 2008 were as follows (in millions):
March 31,
2009
% of Net
Revenue
March 31,
2008
% of Net
Revenue $ Change % Change
$1,359 32% $1,145 31% $214 19%
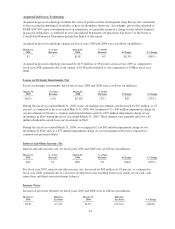
Research and development expenses increased by $214 million, or 19 percent, in fiscal year 2009, as compared
to fiscal year 2008. The increase was primarily due to (1) higher external development costs of $120 million due
to a greater number of projects in development as compared to the prior year and the recognition of costs related
to our acquisition of VGH for all of fiscal year 2009 compared to approximately three months in fiscal year 2008,
(2) an increase of $66 million in additional personnel-related costs primarily resulting from an increase in
headcount prior to actions taken under our fiscal 2009 restructuring, (3) an increase of $43 million in stock-based
compensation expense, and (4) an increase in facilities-related expenses of $8 million to support our research and
development functions worldwide. These increases were partially offset by a decrease of $26 million in
incentive-based compensation expense.
52