Electronic Arts 2010 Annual Report Download - page 50
Download and view the complete annual report
Please find page 50 of the 2010 Electronic Arts annual report below. You can navigate through the pages in the report by either clicking on the pages listed below, or by using the keyword search tool below to find specific information within the annual report.-
 1
1 -
2
-
3
-
4
-
5
-
6
-
7
-
8
-
9
-
10
-
11
-
12
-
13
-
14
-
15
-
16
-
17
-
18
-
19
-
20
-
21
-
22
-
23
-
24
-
25
-
26
-
27
-
28
-
29
-
30
-
31
-
32
-
33
-
34
-
35
-
36
-
37
-
38
-
39
-
 40
40 -
 41
41 -
 42
42 -
 43
43 -
 44
44 -
 45
45 -
 46
46 -
 47
47 -
 48
48 -
 49
49 -
 50
50 -
 51
51 -
 52
52 -
 53
53 -
 54
54 -
 55
55 -
 56
56 -
 57
57 -
 58
58 -
 59
59 -
 60
60 -
61
-
62
-
63
-
64
-
65
-
66
-
67
-
68
-
69
-
70
-
71
-
72
-
73
-
74
-
75
-
76
-
77
-
78
-
79
-
80
-
81
-
82
-
83
-
84
-
85
-
86
-
87
-
88
-
89
-
90
-
91
-
92
-
93
-
94
-
95
-
96
-
97
-
98
-
99
-
100
-
101
-
102
-
103
-
104
-
105
-
106
-
107
-
108
-
109
-
110
-
111
-
112
-
113
-
114
-
115
-
116
-
117
-
118
-
119
-
120
-
121
-
122
-
123
-
124
-
125
-
126
-
127
-
128
-
129
-
130
-
131
-
132
-
133
-
134
-
135
-
136
-
137
-
138
-
139
-
140
-
141
-
142
-
143
-
144
-
145
-
146
-
147
-
148
-
149
-
150
-
151
-
152
-
153
-
154
-
155
-
156
-
157
-
158
-
159
-
160
-
161
-
162
-
163
-
164
-
165
-
166
-
167
-
168
-
169
-
170
-
171
-
172
-
173
-
174
-
175
-
176
-
177
-
178
-
179
-
180
-
181
-
182
-
183
-
184
-
185
-
186
-
187
-
188
-
189
-
190
-
191
-
192
-
193
-
194
-
195
-
196
-
197
-
198
-
199
-
200
 |
 |

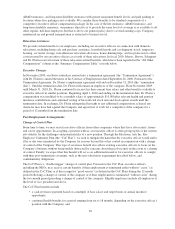
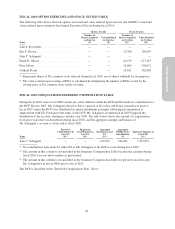
FISCAL 2010 SUMMARY COMPENSATION TABLE
The following table shows information concerning the compensation earned during fiscal 2010 by our Chief
Executive Officer, our Chief Financial Officer and our next four most highly compensated executive officers,
including one former executive officer. For purposes of the compensation tables that follow, we refer to these
individuals collectively as the “Named Executive Officers” or “NEOs”.
Name and Principal Position
Fiscal
Year
Salary
($)
Bonus
($)
Stock
Awards
($)(1)
Option
Awards
($)(3)
Non-Equity
Incentive Plan
Compensation
($)(4)
All Other
Compensation
($)(5)
Total
($)
JOHN S. RICCITIELLO ........2010 800,000 $ — 7,294,950 1,002,287 746,667 1,308 9,845,212
Chief Executive Officer 2009 793,749 — 3,306,633(2)(6) — 400,000 1,308 4,501,690
2008 750,000 — — 16,002,578 625,350 3,958 17,381,886
ERIC F. BROWN .............2010 600,000 — 2,201,680 — 315,000 4,005 3,120,685
Executive Vice President and
Chief Financial Officer
2009 577,731 100,000 5,986,583(2)(7) 4,863,045 200,000 481,459 12,208,818
JOHN C. SCHAPPERT ........2010 424,615(8) 1,000,000(9) 2,502,500(2)(10) 4,106,950 270,000 1,978,556 10,282,621
Chief Operating Officer
PETER MOORE ..............2010 565,000 — 2,657,200 — 401,000 10,919 3,634,119
President, EA SPORTS 2009 564,624 — 2,654,884(2)(11) 782,900 200,000 493,611 4,696,019
2008 317,308(8) 1,500,000 2,686,500 6,269,550 330,000 191,383 11,294,741
FRANK D. GIBEAU ..........2010 545,000 — 2,657,200 — 423,000 10,919 3,636,119
President, EA Games 2009 538,917 — 2,654,884(2)(12) 1,252,640 200,000 8,208 4,654,649
2008 484,395 — 1,264,550 2,280,186 299,542 9,885 4,338,558
GERHARD FLORIN(13) ........2010 713,764 — 4,869,224(14) 117,825(15) — 388,806 6,089,619
Executive Vice President, 2009 656,516 — 2,123,917(2)(16) 626,320 137,042 483,251 4,027,046
Western World Publishing 2008 752,599 — 1,264,550 586,156 349,358 501,061 3,453,724
(1) Represents the aggregate grant-date fair value of restricted stock units (“RSUs”) and Performance-Based RSUs granted in
those years. As required by SEC rules effective for fiscal 2010, the amounts shown for 2008 and 2009 represent the
aggregate fair values of the awards as of their grant date and, therefore, differ from the amounts reported in prior proxy
statements. Grant-date fair value is determined for financial statement reporting purposes and the amounts shown do not
reflect the actual value that will be realized by the recipient. For RSUs, grant-date fair value is calculated using the
closing price of our common stock on the grant date. Refer to footnote 2 below for a discussion of the fair value
calculation for Performance-Based RSUs. For additional information regarding the valuation methodology for RSUs, see
Note 13, “Stock-Based Compensation and Employee Benefit Plans”, of the Consolidated Financial Statements in our
Annual Report on Form 10-K for the fiscal year ended March 31, 2010. For additional information regarding the specific
terms of RSUs granted to NEOs in fiscal 2010, see the “Fiscal 2010 Grants of Plan-Based Awards Table” below.
(2) Includes the aggregate grant-date fair value of Performance-Based RSUs granted in those years. For Performance-Based
RSUs, the grant-date fair value is the target payout on the grant date based on the probable outcome of the performance
condition. For the threshold, target and maximum payout amounts for awards granted in fiscal 2010, see the “Fiscal 2010
Grants of Plan-Based Awards Table” below. For additional information regarding the terms of Performance-Based RSUs
granted to NEOs, see “Equity Awards” in the Compensation Discussion and Analysis above. For additional information
on the valuation methodology for Performance-Based RSUs, see Note 13, “Stock-Based Compensation and Employee
Benefit Plans”, of the Consolidated Financial Statements in our Annual Report on Form 10-K for the fiscal year ended
March 31, 2010.
(3) Represents the grant-date fair value of stock options granted in those years. As required by SEC rules effective for fiscal
2010, the amounts shown for 2008 and 2009 represent the aggregate fair values of the awards as of their grant date and,
therefore, differ from the amounts reported in prior proxy statements. For additional information on the valuation
methodology and assumptions used to calculate the fair value of stock options, see Note 13, “Stock-Based Compensation
and Employee Benefit Plans”, of the Consolidated Financial Statements in our Annual Report on Form 10-K for the fiscal
year ended March 31, 2010.
(4) Represents amounts awarded under EA’s Discretionary Bonus Plan. For additional information about the bonuses paid to
our NEOs in fiscal 2010, see “Discretionary Bonus Plan” in the Compensation Discussion and Analysis above.
42