Electronic Arts 2010 Annual Report Download - page 37
Download and view the complete annual report
Please find page 37 of the 2010 Electronic Arts annual report below. You can navigate through the pages in the report by either clicking on the pages listed below, or by using the keyword search tool below to find specific information within the annual report.-
 1
1 -
2
-
3
-
4
-
5
-
6
-
7
-
8
-
9
-
10
-
11
-
12
-
13
-
14
-
15
-
16
-
17
-
18
-
19
-
20
-
21
-
22
-
23
-
24
-
25
-
26
-
 27
27 -
 28
28 -
 29
29 -
 30
30 -
 31
31 -
 32
32 -
 33
33 -
 34
34 -
 35
35 -
 36
36 -
 37
37 -
 38
38 -
 39
39 -
 40
40 -
 41
41 -
 42
42 -
 43
43 -
 44
44 -
 45
45 -
 46
46 -
 47
47 -
48
-
49
-
50
-
51
-
52
-
53
-
54
-
55
-
56
-
57
-
58
-
59
-
60
-
61
-
62
-
63
-
64
-
65
-
66
-
67
-
68
-
69
-
70
-
71
-
72
-
73
-
74
-
75
-
76
-
77
-
78
-
79
-
80
-
81
-
82
-
83
-
84
-
85
-
86
-
87
-
88
-
89
-
90
-
91
-
92
-
93
-
94
-
95
-
96
-
97
-
98
-
99
-
100
-
101
-
102
-
103
-
104
-
105
-
106
-
107
-
108
-
109
-
110
-
111
-
112
-
113
-
114
-
115
-
116
-
117
-
118
-
119
-
120
-
121
-
122
-
123
-
124
-
125
-
126
-
127
-
128
-
129
-
130
-
131
-
132
-
133
-
134
-
135
-
136
-
137
-
138
-
139
-
140
-
141
-
142
-
143
-
144
-
145
-
146
-
147
-
148
-
149
-
150
-
151
-
152
-
153
-
154
-
155
-
156
-
157
-
158
-
159
-
160
-
161
-
162
-
163
-
164
-
165
-
166
-
167
-
168
-
169
-
170
-
171
-
172
-
173
-
174
-
175
-
176
-
177
-
178
-
179
-
180
-
181
-
182
-
183
-
184
-
185
-
186
-
187
-
188
-
189
-
190
-
191
-
192
-
193
-
194
-
195
-
196
-
197
-
198
-
199
-
200
 |
 |

Proxy Statement
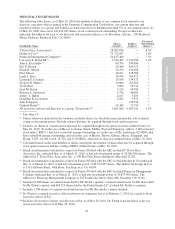
This Peer Group is the result of a re-evaluation of the prior fiscal year’s group of peer companies performed in
November 2009 based on relevance to our industry (Gaming & Entertainment and/or Internet and Technology),
revenue size ($1.3 billion to $8.4 billion) and revenue growth (generally 15%+). Amazon.com Inc. and Viacom,
Inc., with revenues of $19 billion and $14 billion, respectively, were considered too large for comparison
purposes and were removed from the Peer Group. They were replaced with Expedia, Inc. and Discovery
Communications, with revenues of $2.9 billion and $3.4 billion, respectively.
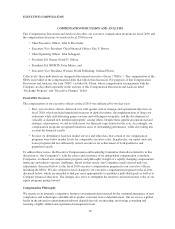
Compensia compared each of our executive-level positions to similar positions as reflected in the survey data and
the Peer Group information to establish base salary, target cash bonus and equity award, and target total cash
compensation ranges. This analysis was reviewed by Ms. Toledano and our Human Resources Department with
Mr. Riccitiello for each executive-level position and with the Committee for our Chief Executive Officer and for
other positions at or above the level of Senior Vice President.
The Committee used the survey data and the Peer Group information to validate the range of competitive pay for the
business sectors in which we compete for executive talent. Based on its assessment of the competitive marketplace
and our need for a strong leadership team to help us achieve our strategic and operating objectives, the Committee
identified the 50th to 75th percentile of the combined survey data and Peer Group information as the relevant
reference for base salaries, target bonus opportunities, and total cash compensation, and the 75th percentile for equity
awards for our executive officers. During fiscal 2010, these base salary, target bonus opportunity, and target total
cash compensation ranges were referenced by management in preparing individual compensation recommendations
for the Committee to consider, and made available to the Committee in making compensation decisions.
The market ranges established by Compensia also helped the Committee in assessing the competitive placement of
our executive officers’ total direct compensation for fiscal 2010. The Committee’s assessment of an individual
executive officer’s compensation relative to market range took into consideration the scope, complexity, and
responsibility of the executive officer’s position in relation to positions in the data sources. Market range data was
just one factor considered by the Committee. In setting actual compensation, the Committee also considered each
executive officer’s experience, responsibility level, individual performance, and the Company’s actual financial and
operational results for the year. In addition, the Committee compared the compensation of the executive officers
with each other to monitor internal pay equity. Because these decisions were influenced by the Company’s
financial and operational results, as well as each executive officer’s individual performance, his or her total cash
compensation, and any individual compensation component, may be within, below, or above the market range for
his or her position.
CEO Compensation Process
At the beginning of each fiscal year, Mr. Riccitiello and the Board agree on the operating objectives for the
Company, against which Mr. Riccitiello’s performance will be judged for the purposes of evaluating his
performance and setting his compensation.
The Nominating and Governance Committee of the Board, with the assistance of Ms. Toledano, reviews
Mr. Riccitiello’s performance, taking into consideration Mr. Riccitiello’s and the Company’s achievement of the
objectives stated above, and other factors that the Nominating and Governance Committee deems important and
material in evaluating Mr. Riccitiello’s performance. This review is then provided to the Committee, which
makes a compensation recommendation to the full Board. The Board then considers the performance review
made by the Nominating and Governance Committee, and the compensation recommendations made by the
Committee, and determines Mr. Riccitiello’s compensation.
Compensation Elements
Our executive compensation program is comprised of three principal components: base salary, an annual cash
bonus and equity awards. Below is a description of each compensation component, a discussion of how these
three compensation components specifically applied to each of our NEOs for fiscal 2010, and an explanation of
why specific compensation decisions were made during fiscal 2010. Where applicable, executive compensation
program changes for fiscal 2011 are also discussed.
29