Electronic Arts 2010 Annual Report Download - page 164
Download and view the complete annual report
Please find page 164 of the 2010 Electronic Arts annual report below. You can navigate through the pages in the report by either clicking on the pages listed below, or by using the keyword search tool below to find specific information within the annual report.-
 1
1 -
2
-
3
-
4
-
5
-
6
-
7
-
8
-
9
-
10
-
11
-
12
-
13
-
14
-
15
-
16
-
17
-
18
-
19
-
20
-
21
-
22
-
23
-
24
-
25
-
26
-
27
-
28
-
29
-
30
-
31
-
32
-
33
-
34
-
35
-
36
-
37
-
38
-
39
-
40
-
41
-
42
-
43
-
44
-
45
-
46
-
47
-
48
-
49
-
50
-
51
-
52
-
53
-
54
-
55
-
56
-
57
-
58
-
59
-
60
-
61
-
62
-
63
-
64
-
65
-
66
-
67
-
68
-
69
-
70
-
71
-
72
-
73
-
74
-
75
-
76
-
77
-
78
-
79
-
80
-
81
-
82
-
83
-
84
-
85
-
86
-
87
-
88
-
89
-
90
-
91
-
92
-
93
-
94
-
95
-
96
-
97
-
98
-
99
-
100
-
101
-
102
-
103
-
104
-
105
-
106
-
107
-
108
-
109
-
110
-
111
-
112
-
113
-
114
-
115
-
116
-
117
-
118
-
119
-
120
-
121
-
122
-
123
-
124
-
125
-
126
-
127
-
128
-
129
-
130
-
131
-
132
-
133
-
134
-
135
-
136
-
137
-
138
-
139
-
140
-
141
-
142
-
143
-
144
-
145
-
146
-
147
-
148
-
149
-
150
-
151
-
152
-
153
-
 154
154 -
 155
155 -
 156
156 -
 157
157 -
 158
158 -
 159
159 -
 160
160 -
 161
161 -
 162
162 -
 163
163 -
 164
164 -
 165
165 -
 166
166 -
 167
167 -
 168
168 -
 169
169 -
 170
170 -
 171
171 -
 172
172 -
 173
173 -
 174
174 -
175
-
176
-
177
-
178
-
179
-
180
-
181
-
182
-
183
-
184
-
185
-
186
-
187
-
188
-
189
-
190
-
191
-
192
-
193
-
194
-
195
-
196
-
197
-
198
-
199
-
200
 |
 |

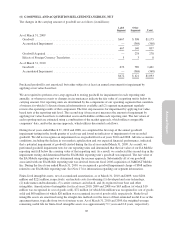
The results of operations of VGH and the estimated fair market values of the assets acquired and liabilities
assumed have been included in our Consolidated Financial Statements since the date of acquisition.
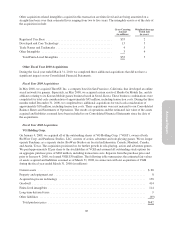
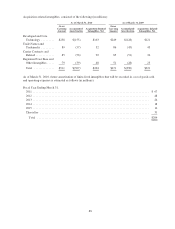
Except for acquired in-process technology, which is discussed below, acquired finite-lived intangible assets are
being amortized on a straight-line basis over their estimated lives ranging from three to five years. The intangible
assets that make up that amount as of the date of the acquisition include:
Gross Carrying
Amount
(in millions)
Weighted-Average
Useful Life
(in years)
Developed and Core Technology .................................... $ 51 4
Trade Names and Trademarks ...................................... 41 5
Other Intangibles ................................................ 22 3
Total Finite-Lived Intangibles .................................... $114 4
Approximately $47 million of the goodwill recognized upon acquisition is deductible for tax purposes.
In connection with our acquisition of VGH, we incurred acquired in-process technology charges of $138 million
in relation to game software that had not reached technical feasibility as of the date of acquisition. The fair value
of VGH’s products under development was determined using the income approach, which discounts expected
future cash flows from the acquired in-process technology to present value. The discount rates used in the present
value calculations were derived from a weighted average cost of capital of 17 percent. Should the in-process
software not be successfully completed, completed at a higher cost, or the development efforts go beyond the
timeframe estimated by management, we may not receive the full benefits anticipated from the acquisition.
Benefits from the development efforts began to be received in fiscal year 2009 and the development efforts are
expected to be completed in fiscal year 2012.
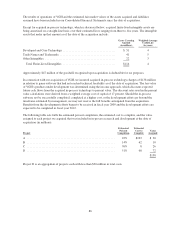
The following table sets forth the estimated percent completion, the estimated cost to complete, and the value
assigned to each project we acquired that was included in in-process research and development at the date of
acquisition (in millions):
Project
Estimated
Percent
Completion
Estimated
Cost to
Complete
Value
Assigned
A ............................................................ 22% $103 $ 30
B ............................................................ 14% 62 10
C ............................................................ 76% 8 26
D ............................................................ 51% 68 72
$138
Project D is an aggregation of projects each with less than $30 million in total costs.
86