Electronic Arts 2010 Annual Report Download - page 121
Download and view the complete annual report
Please find page 121 of the 2010 Electronic Arts annual report below. You can navigate through the pages in the report by either clicking on the pages listed below, or by using the keyword search tool below to find specific information within the annual report.-
 1
1 -
2
-
3
-
4
-
5
-
6
-
7
-
8
-
9
-
10
-
11
-
12
-
13
-
14
-
15
-
16
-
17
-
18
-
19
-
20
-
21
-
22
-
23
-
24
-
25
-
26
-
27
-
28
-
29
-
30
-
31
-
32
-
33
-
34
-
35
-
36
-
37
-
38
-
39
-
40
-
41
-
42
-
43
-
44
-
45
-
46
-
47
-
48
-
49
-
50
-
51
-
52
-
53
-
54
-
55
-
56
-
57
-
58
-
59
-
60
-
61
-
62
-
63
-
64
-
65
-
66
-
67
-
68
-
69
-
70
-
71
-
72
-
73
-
74
-
75
-
76
-
77
-
78
-
79
-
80
-
81
-
82
-
83
-
84
-
85
-
86
-
87
-
88
-
89
-
90
-
91
-
92
-
93
-
94
-
95
-
96
-
97
-
98
-
99
-
100
-
101
-
102
-
103
-
104
-
105
-
106
-
107
-
108
-
109
-
110
-
 111
111 -
 112
112 -
 113
113 -
 114
114 -
 115
115 -
 116
116 -
 117
117 -
 118
118 -
 119
119 -
 120
120 -
 121
121 -
 122
122 -
 123
123 -
 124
124 -
 125
125 -
 126
126 -
 127
127 -
 128
128 -
 129
129 -
 130
130 -
 131
131 -
132
-
133
-
134
-
135
-
136
-
137
-
138
-
139
-
140
-
141
-
142
-
143
-
144
-
145
-
146
-
147
-
148
-
149
-
150
-
151
-
152
-
153
-
154
-
155
-
156
-
157
-
158
-
159
-
160
-
161
-
162
-
163
-
164
-
165
-
166
-
167
-
168
-
169
-
170
-
171
-
172
-
173
-
174
-
175
-
176
-
177
-
178
-
179
-
180
-
181
-
182
-
183
-
184
-
185
-
186
-
187
-
188
-
189
-
190
-
191
-
192
-
193
-
194
-
195
-
196
-
197
-
198
-
199
-
200
 |
 |

Annual Report
Non-GAAP Financial Measures
Net Revenue before Revenue Deferral is a non-GAAP financial measure that excludes the impact of Revenue
Deferral and the Recognition of Revenue Deferral on Net Revenue related to packaged goods games and digital
content. We defer Net Revenue from sales of certain online-enabled packaged goods and digital content for
which we are not able to objectively determine the fair value (as defined by accounting principles generally
accepted in the United States for software sales) of the online service that we provided in connection with the
sale. We recognize the revenue from these games over the estimated online service period. We also defer Net
Revenue from sales of certain online-enabled packaged goods and digital content for which we had an obligation
to deliver incremental unspecified digital content in the future without an additional fee. We recognize the
revenue for these games on a straight-line basis over the estimated life of the game.
We believe that excluding the impact of Revenue Deferral and the Recognition of Revenue Deferral related to
packaged goods games and digital content from our operating results is important to facilitate comparisons
between years in understanding our underlying sales performance for the period.
We use this non-GAAP measure internally to evaluate our operating performance, when planning, forecasting
and analyzing future periods, and when assessing the performance of our management team. While we believe
that this non-GAAP financial measure is useful in evaluating our business, this information should be considered
as supplemental in nature and is not meant to be considered in isolation from or as a substitute for the related
financial information prepared in accordance with GAAP. In addition, this non-GAAP financial measure may not
be the same as non-GAAP measures presented by other companies.
Cost of Goods Sold
Cost of goods sold for our packaged-goods business consists of (1) product costs, (2) certain royalty expenses for
celebrities, professional sports and other organizations and independent software developers, (3) manufacturing
royalties, net of volume discounts and other vendor reimbursements, (4) expenses for defective products,
(5) write-offs of post-launch prepaid royalty costs, (6) amortization of certain intangible assets, (7) personnel-
related costs, and (8) warehousing and distribution costs. We generally recognize volume discounts when they
are earned from the manufacturer (typically in connection with the achievement of unit-based milestones),
whereas other vendor reimbursements are generally recognized as the related revenue is recognized. Cost of
goods sold for our online products consists primarily of data center and bandwidth costs associated with hosting
our web sites, credit card fees and royalties for use of third-party properties. Cost of goods sold for our web site
advertising business primarily consists of server costs.
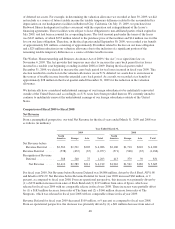
Cost of goods sold for fiscal years 2010 and 2009 were as follows (in millions):
March 31,
2010
% of Net
Revenue
March 31,
2009
% of Net
Revenue % Change
Change as a
% of Net
Revenue
$1,866 51.1% $2,127 50.5% (12.3%) 0.6%
During fiscal year 2010, cost of goods sold increased by 0.6 percent as a percentage of total net revenue as
compared to fiscal year 2009. This increase was primarily due to a $631 million increase in deferred net revenue
related to certain online-enabled packaged goods and digital content for the twelve months ended March 31,
2010, as compared to the twelve months ended March 31, 2009. Overall, we estimate the increase in deferred net
revenue related to certain online-enabled packaged goods and digital content negatively impacted cost of goods
sold as a percent of total net revenue by 7.7 percentage points. The overall increase in cost of goods sold as a
percentage of net revenue was partially mitigated by (1) a greater percentage of net revenue from EA studio
products, which have a higher margin than our co-publishing and distribution products, which positively
impacted cost of goods sold as a percentage of total revenue by approximately 3.1 percent and (2) EA Studio
products that we sold which had previously been written down to a lower costs basis and lower inventory write
downs on our fiscal year 2010 releases as compared to our fiscal year 2009 releases, which positively impacted
cost of goods sold as a percentage of total revenue by approximately 2.1 percent.
43