Electronic Arts 2010 Annual Report Download - page 95
Download and view the complete annual report
Please find page 95 of the 2010 Electronic Arts annual report below. You can navigate through the pages in the report by either clicking on the pages listed below, or by using the keyword search tool below to find specific information within the annual report.-
 1
1 -
2
-
3
-
4
-
5
-
6
-
7
-
8
-
9
-
10
-
11
-
12
-
13
-
14
-
15
-
16
-
17
-
18
-
19
-
20
-
21
-
22
-
23
-
24
-
25
-
26
-
27
-
28
-
29
-
30
-
31
-
32
-
33
-
34
-
35
-
36
-
37
-
38
-
39
-
40
-
41
-
42
-
43
-
44
-
45
-
46
-
47
-
48
-
49
-
50
-
51
-
52
-
53
-
54
-
55
-
56
-
57
-
58
-
59
-
60
-
61
-
62
-
63
-
64
-
65
-
66
-
67
-
68
-
69
-
70
-
71
-
72
-
73
-
74
-
75
-
76
-
77
-
78
-
79
-
80
-
81
-
82
-
83
-
84
-
 85
85 -
 86
86 -
 87
87 -
 88
88 -
 89
89 -
 90
90 -
 91
91 -
 92
92 -
 93
93 -
 94
94 -
 95
95 -
 96
96 -
 97
97 -
 98
98 -
 99
99 -
 100
100 -
 101
101 -
 102
102 -
 103
103 -
 104
104 -
 105
105 -
106
-
107
-
108
-
109
-
110
-
111
-
112
-
113
-
114
-
115
-
116
-
117
-
118
-
119
-
120
-
121
-
122
-
123
-
124
-
125
-
126
-
127
-
128
-
129
-
130
-
131
-
132
-
133
-
134
-
135
-
136
-
137
-
138
-
139
-
140
-
141
-
142
-
143
-
144
-
145
-
146
-
147
-
148
-
149
-
150
-
151
-
152
-
153
-
154
-
155
-
156
-
157
-
158
-
159
-
160
-
161
-
162
-
163
-
164
-
165
-
166
-
167
-
168
-
169
-
170
-
171
-
172
-
173
-
174
-
175
-
176
-
177
-
178
-
179
-
180
-
181
-
182
-
183
-
184
-
185
-
186
-
187
-
188
-
189
-
190
-
191
-
192
-
193
-
194
-
195
-
196
-
197
-
198
-
199
-
200
 |
 |

Annual Report
secure credit-worthy counterparties for our foreign currency hedging programs. Accordingly, our results of
operations, including our reported net revenue, operating expenses and net income, and financial condition can
be adversely affected by unfavorable foreign currency fluctuations, especially the Euro, British pound sterling
and Canadian dollar.
Volatility in the capital markets may adversely impact the value of our investments and could cause us to
recognize significant impairment charges in our operating results.
Our portfolio of short-term investments and marketable equity securities is subject to volatility in the capital
markets and to national and international economic conditions. In particular, our international investments can be
subject to fluctuations in foreign currency and our short-term investments are susceptible to changes in short-
term interest rates. These investments are also impacted by declines in value attributable to the credit-worthiness
of the issuer. From time to time, we may liquidate some or all of our short-term investments or marketable equity
securities to fund operational needs or other activities, such as capital expenditures, strategic investments or
business acquisitions, or for other purposes. If we were to liquidate these short-term investments at a time when
they were worth less than what we had originally purchased them for, or if the obligor were unable to pay the full
amount at maturity, we could incur a significant loss. Similarly, we hold marketable equity securities, which have
been and may continue to be adversely impacted by price and trading volume volatility in the public stock
markets. We could be required to recognize impairment charges on the securities held by us and/or we may
realize losses on the sale of these securities, all of which could have an adverse effect on our financial condition
and results of operations. For the fiscal year ended March 31, 2010, we recognized impairment charges of $26
million on our investment in The9.
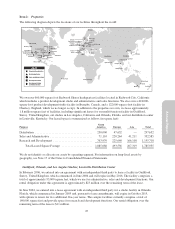
The majority of our sales are made to a relatively small number of key customers. If these customers
reduce their purchases of our products or become unable to pay for them, our business could be harmed.
During the fiscal year ended March 31, 2010, approximately 75 percent of our North American sales were made
to our top ten customers. In Europe, our top ten customers accounted for approximately 48 percent of our sales in
that territory during the fiscal year ended March 31, 2010. Worldwide, we had direct sales to two customers,
GameStop Corp. and Wal-Mart Stores Inc., which represented approximately 16 percent and 12 percent,
respectively, of total net revenue for the fiscal year ended March 31, 2010. As a result of the economic downturn,
retailers globally continue to take a more conservative stance in ordering game inventory. Though our products
are available to consumers through a variety of retailers, the concentration of our sales in one, or a few, large
customers could lead to a short-term disruption in our sales if one or more of these customers significantly
reduced their purchases or ceased to carry our products, and could make us more vulnerable to collection risk if
one or more of these large customers became unable to pay for our products or declared bankruptcy.
Additionally, our receivables from these large customers increase significantly in the December quarter as they
make purchases in anticipation of the holiday selling season. Also, having such a large portion of our total net
revenue concentrated in a few customers could reduce our negotiating leverage with these customers. If one or
more of our key customers experience deterioration in their business, or become unable to obtain sufficient
financing to maintain their operations, our business could be harmed.
Sales of used video game products could lower our sales of new video games.
Certain of our retail customers sell used video games. Used video game sales have been growing in North
America, and are emerging in Europe. Used video games are generally priced lower than new video games and
the margins on used games sales are generally greater for retailers than the margins on new game sales. We do
not receive revenue from used video game sales. Sales of used video games may negatively impact our sales and
profitability, and may continue to do so, to a greater or lesser extent, in the future.
Our industry is cyclical, driven by the periodic introduction of new video game hardware systems. As we
continue to move through the current cycle, our industry growth may slow down and as a result, our
operating results may be difficult to predict.
Video game hardware systems have historically had a life cycle of four to six years, which causes the video game
software market to be cyclical as well. The current cycle began with Microsoft’s launch of the Xbox 360 in 2005,
17