Electronic Arts 2010 Annual Report Download - page 135
Download and view the complete annual report
Please find page 135 of the 2010 Electronic Arts annual report below. You can navigate through the pages in the report by either clicking on the pages listed below, or by using the keyword search tool below to find specific information within the annual report.-
 1
1 -
2
-
3
-
4
-
5
-
6
-
7
-
8
-
9
-
10
-
11
-
12
-
13
-
14
-
15
-
16
-
17
-
18
-
19
-
20
-
21
-
22
-
23
-
24
-
25
-
26
-
27
-
28
-
29
-
30
-
31
-
32
-
33
-
34
-
35
-
36
-
37
-
38
-
39
-
40
-
41
-
42
-
43
-
44
-
45
-
46
-
47
-
48
-
49
-
50
-
51
-
52
-
53
-
54
-
55
-
56
-
57
-
58
-
59
-
60
-
61
-
62
-
63
-
64
-
65
-
66
-
67
-
68
-
69
-
70
-
71
-
72
-
73
-
74
-
75
-
76
-
77
-
78
-
79
-
80
-
81
-
82
-
83
-
84
-
85
-
86
-
87
-
88
-
89
-
90
-
91
-
92
-
93
-
94
-
95
-
96
-
97
-
98
-
99
-
100
-
101
-
102
-
103
-
104
-
105
-
106
-
107
-
108
-
109
-
110
-
111
-
112
-
113
-
114
-
115
-
116
-
117
-
118
-
119
-
120
-
121
-
122
-
123
-
124
-
 125
125 -
 126
126 -
 127
127 -
 128
128 -
 129
129 -
 130
130 -
 131
131 -
 132
132 -
 133
133 -
 134
134 -
 135
135 -
 136
136 -
 137
137 -
 138
138 -
 139
139 -
 140
140 -
 141
141 -
 142
142 -
 143
143 -
 144
144 -
 145
145 -
146
-
147
-
148
-
149
-
150
-
151
-
152
-
153
-
154
-
155
-
156
-
157
-
158
-
159
-
160
-
161
-
162
-
163
-
164
-
165
-
166
-
167
-
168
-
169
-
170
-
171
-
172
-
173
-
174
-
175
-
176
-
177
-
178
-
179
-
180
-
181
-
182
-
183
-
184
-
185
-
186
-
187
-
188
-
189
-
190
-
191
-
192
-
193
-
194
-
195
-
196
-
197
-
198
-
199
-
200
 |
 |

Annual Report
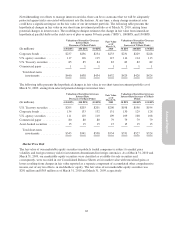
fourth quarter of fiscal year 2010 as compared to the fourth quarter of fiscal year 2009. Reserves for sales
returns, pricing allowances and doubtful accounts as of March 31, 2010 and 2009 was flat at $217 million. As a
percentage of trailing nine month net revenue, reserves increased from 6 percent as of March 31, 2009, to 7
percent as of March 31, 2010. We believe these reserves are adequate based on historical experience and our
current estimate of potential returns, pricing allowances and doubtful accounts.
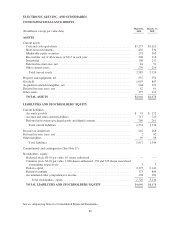
Inventories
Inventories decreased to $100 million as of March 31, 2010 from $217 million as of March 31, 2009, primarily
as a result of lower Rock Band inventory.
Other Current Assets and Other Assets
Other current assets increased to $239 million as of March 31, 2010, from $216 million as of March 31, 2009,
while other assets increased to $175 million as of March 31, 2010 from $115 million as of March 31, 2009. Other
current assets and other assets combined, increased by $83 million primarily due to a $100 million increase in
acquisition-related restricted cash for contingent consideration in connection with our acquisition of Playfish.
Accounts Payable
Accounts payable decreased to $91 million as of March 31, 2010, from $152 million as of March 31, 2009,
primarily due to payments related to our inventory purchases and royalty payables.
Accrued and Other Current Liabilities
Our accrued and other current liabilities decreased to $717 million as of March 31, 2010 from $723 million as of
March 31, 2009. The $6 million decrease was primarily due to a $93 million decrease in accrued royalties. This
decrease was partially offset by (1) a $39 million increase in contingent consideration in connection with our
acquisition of Playfish and (2) an increase of $35 million in our accrued compensation and benefits.
Deferred income taxes, net
Our net deferred income tax asset position increased by $22 million as of March 31, 2010 as compared to
March 31, 2009 primarily due to (1) an increase of $12 million for tax credit and loss carryovers in Canada and
the United Kingdom and (2) a net increase of $5 million in U.S. deferred taxes for decreases in the valuation
allowance offset by changes in the netting of deferred taxes with liabilities for unrecognized tax benefits.
Financial Condition
We believe that cash, cash equivalents, short-term investments, marketable equity securities, cash generated from
operations and available financing facilities will be sufficient to meet our operating requirements for at least the
next twelve months, including working capital requirements, capital expenditures and, potentially, future
acquisitions or strategic investments. We may choose at any time to raise additional capital to strengthen our
financial position, facilitate expansion, pursue strategic acquisitions and investments or to take advantage of
business opportunities as they arise. There can be no assurance, however, that such additional capital will be
available to us on favorable terms, if at all, or that it will not result in substantial dilution to our existing
stockholders.
The loan financing arrangements supporting our Redwood City headquarters leases, described in the “Off-
Balance Sheet Commitments” section below, expired in July 2009. On July 13, 2009, we purchased our Redwood
Shores headquarters facilities comprised of approximately 660,000 square feet concurrent with the expiration and
extinguishment of the lessor’s financing agreements. These facilities were subject to lease obligations to
non-affiliated parties, which expired in July 2009, and had previously been accounted for as operating leases. The
total amount paid under the terms of the leases was $247 million, of which $233 million related to the purchase
price of the facilities and $14 million was for the loss on our lease obligation.
57