Electronic Arts 2010 Annual Report Download - page 158
Download and view the complete annual report
Please find page 158 of the 2010 Electronic Arts annual report below. You can navigate through the pages in the report by either clicking on the pages listed below, or by using the keyword search tool below to find specific information within the annual report.-
 1
1 -
2
-
3
-
4
-
5
-
6
-
7
-
8
-
9
-
10
-
11
-
12
-
13
-
14
-
15
-
16
-
17
-
18
-
19
-
20
-
21
-
22
-
23
-
24
-
25
-
26
-
27
-
28
-
29
-
30
-
31
-
32
-
33
-
34
-
35
-
36
-
37
-
38
-
39
-
40
-
41
-
42
-
43
-
44
-
45
-
46
-
47
-
48
-
49
-
50
-
51
-
52
-
53
-
54
-
55
-
56
-
57
-
58
-
59
-
60
-
61
-
62
-
63
-
64
-
65
-
66
-
67
-
68
-
69
-
70
-
71
-
72
-
73
-
74
-
75
-
76
-
77
-
78
-
79
-
80
-
81
-
82
-
83
-
84
-
85
-
86
-
87
-
88
-
89
-
90
-
91
-
92
-
93
-
94
-
95
-
96
-
97
-
98
-
99
-
100
-
101
-
102
-
103
-
104
-
105
-
106
-
107
-
108
-
109
-
110
-
111
-
112
-
113
-
114
-
115
-
116
-
117
-
118
-
119
-
120
-
121
-
122
-
123
-
124
-
125
-
126
-
127
-
128
-
129
-
130
-
131
-
132
-
133
-
134
-
135
-
136
-
137
-
138
-
139
-
140
-
141
-
142
-
143
-
144
-
145
-
146
-
147
-
 148
148 -
 149
149 -
 150
150 -
 151
151 -
 152
152 -
 153
153 -
 154
154 -
 155
155 -
 156
156 -
 157
157 -
 158
158 -
 159
159 -
 160
160 -
 161
161 -
 162
162 -
 163
163 -
 164
164 -
 165
165 -
 166
166 -
 167
167 -
 168
168 -
169
-
170
-
171
-
172
-
173
-
174
-
175
-
176
-
177
-
178
-
179
-
180
-
181
-
182
-
183
-
184
-
185
-
186
-
187
-
188
-
189
-
190
-
191
-
192
-
193
-
194
-
195
-
196
-
197
-
198
-
199
-
200
 |
 |

certain of our other investments at fair value due to various factors, including but not limited to, the extent and
duration during which the fair value had been below cost. See Note 3 for information regarding other
investments.
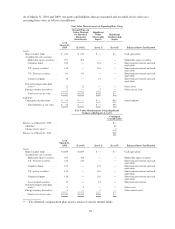
(3) FINANCIAL INSTRUMENTS
Cash, Cash Equivalents and Short-Term Investments
Cash, cash equivalents and short-term investments consisted of the following as of March 31, 2010 and 2009 (in
millions):
As of March 31, 2010 As of March 31, 2009
Cost or
Amortized
Cost
Gross
Unrealized Fair
Value
Cost or
Amortized
Cost
Gross
Unrealized Fair
ValueGains Losses Gains Losses
Cash and cash equivalents:
Cash ............................... $ 629 $— $— $ 629 $ 490 $— $— $ 490
Money market funds .................. 619 — — 619 1,069 — — 1,069
Commercial paper .................... 11 — — 11 39 — — 39
U.S. Treasury securities ................ 10 — — 10 12 — — 12
U.S. agency securities ................. 3 — — 3 9 — — 9
Corporate bonds ...................... 1 — — 1 2 — — 2
Cash and cash equivalents ............ 1,273 — — 1,273 1,621 — — 1,621
Short-term investments:
Corporate bonds ...................... 231 2 — 233 130 1 — 131
U.S. agency securities ................. 115 — — 115 108 1 — 109
U.S. Treasury securities ................ 83 — — 83 198 2 — 200
Commercial paper .................... 1 — — 1 79 — — 79
Asset-backed securities ................ — — — — 15 — — 15
Short-term investments .............. 430 2 — 432 530 4 — 534
Cash, cash equivalents and short-term
investments .......................... $1,703 $ 2 $— $1,705 $2,151 $ 4 $— $2,155
We evaluate our investments for impairment quarterly. Factors considered in the review of investments with an
unrealized loss include the credit quality of the issuer, the duration that the fair value has been less than the
adjusted cost basis, severity of the impairment, reason for the decline in value and potential recovery period, the
financial condition and near-term prospects of the investees, our intent to sell the investments, any contractual
terms impacting the prepayment or settlement process, as well as if we would be required to sell an investment
due to liquidity or contractual reasons before its anticipated recovery. Based on our review, we did not consider
the investments listed above to be other-than-temporarily impaired as of March 31, 2010 and 2009.
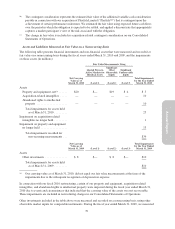
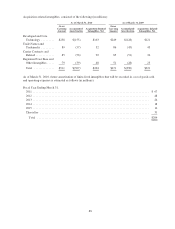
The following table summarizes the amortized cost and fair value of our short-term investments, classified by
stated maturity as of March 31, 2010 and 2009 (in millions):
As of March 31, 2010 As of March 31, 2009
Amortized
Cost
Fair
Value
Amortized
Cost
Fair
Value
Short-term investments excluding asset-backed securities
Due in 1 year or less ........................................... $165 $165 $245 $245
Due in 1-2 years .............................................. 174 176 156 159
Due in 2-3 years .............................................. 91 91 114 115
Asset-backed securities
Weighted average maturity less than 1 year ......................... — — 15 15
Short-term investments ....................................... $430 $432 $530 $534
80