Electronic Arts 2010 Annual Report Download - page 123
Download and view the complete annual report
Please find page 123 of the 2010 Electronic Arts annual report below. You can navigate through the pages in the report by either clicking on the pages listed below, or by using the keyword search tool below to find specific information within the annual report.-
 1
1 -
2
-
3
-
4
-
5
-
6
-
7
-
8
-
9
-
10
-
11
-
12
-
13
-
14
-
15
-
16
-
17
-
18
-
19
-
20
-
21
-
22
-
23
-
24
-
25
-
26
-
27
-
28
-
29
-
30
-
31
-
32
-
33
-
34
-
35
-
36
-
37
-
38
-
39
-
40
-
41
-
42
-
43
-
44
-
45
-
46
-
47
-
48
-
49
-
50
-
51
-
52
-
53
-
54
-
55
-
56
-
57
-
58
-
59
-
60
-
61
-
62
-
63
-
64
-
65
-
66
-
67
-
68
-
69
-
70
-
71
-
72
-
73
-
74
-
75
-
76
-
77
-
78
-
79
-
80
-
81
-
82
-
83
-
84
-
85
-
86
-
87
-
88
-
89
-
90
-
91
-
92
-
93
-
94
-
95
-
96
-
97
-
98
-
99
-
100
-
101
-
102
-
103
-
104
-
105
-
106
-
107
-
108
-
109
-
110
-
111
-
112
-
 113
113 -
 114
114 -
 115
115 -
 116
116 -
 117
117 -
 118
118 -
 119
119 -
 120
120 -
 121
121 -
 122
122 -
 123
123 -
 124
124 -
 125
125 -
 126
126 -
 127
127 -
 128
128 -
 129
129 -
 130
130 -
 131
131 -
 132
132 -
 133
133 -
134
-
135
-
136
-
137
-
138
-
139
-
140
-
141
-
142
-
143
-
144
-
145
-
146
-
147
-
148
-
149
-
150
-
151
-
152
-
153
-
154
-
155
-
156
-
157
-
158
-
159
-
160
-
161
-
162
-
163
-
164
-
165
-
166
-
167
-
168
-
169
-
170
-
171
-
172
-
173
-
174
-
175
-
176
-
177
-
178
-
179
-
180
-
181
-
182
-
183
-
184
-
185
-
186
-
187
-
188
-
189
-
190
-
191
-
192
-
193
-
194
-
195
-
196
-
197
-
198
-
199
-
200
 |
 |

Annual Report
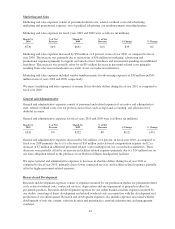
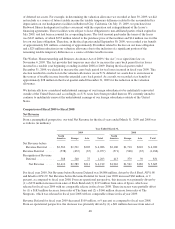
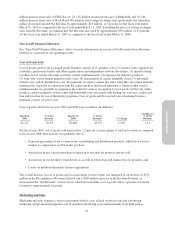
Research and development expenses for fiscal years 2010 and 2009 were as follows (in millions):
March 31,
2010
% of Net
Revenue
March 31,
2009
% of Net
Revenue $ Change % Change
$1,229 34% $1,359 32% $(130) (10%)
Research and development expenses decreased by $130 million, or 10 percent, in fiscal year 2010, as compared
to fiscal year 2009. The decrease was primarily due to (1) a decrease of $82 million in additional personnel-
related costs primarily resulting from our cost reduction initiatives, (2) a decrease of $46 million in external
development and contracted services, and (3) a decrease of $24 million in stock-based compensation expense.
These decreases were partially offset by a $23 million increase in incentive-based compensation expense.
We expect research and development expenses to decrease in absolute dollars during fiscal year 2011 as
compared to fiscal year 2010 primarily due to a decrease in external development costs and lower facilities-
related expenses.
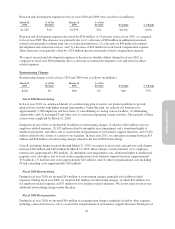
Restructuring Charges
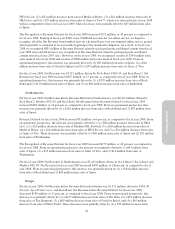
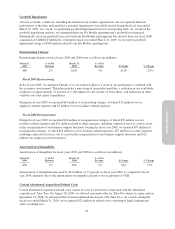
Restructuring charges for fiscal years 2010 and 2009 were as follows (in millions):
March 31,
2010
% of Net
Revenue
March 31,
2009
% of Net
Revenue $ Change % Change
$140 4% $80 2% $60 75%
Fiscal 2010 Restructuring
In fiscal year 2010, we announced details of a restructuring plan to narrow our product portfolio to provide
greater focus on titles with higher margin opportunities. Under this plan, we reduced our workforce by
approximately 1,200 employees and have been (1) consolidating or closing various facilities, (2) eliminating
certain titles, and (3) incurring IT and other costs to assist in reorganizing certain activities. The majority of these
actions were completed by March 31, 2010.
During fiscal year 2010, we incurred $116 million of restructuring charges, of which (1) $62 million were for
employee-related expenses, (2) $32 million related to intangible asset impairment costs, abandoned rights to
intellectual property, and other costs to assist in the reorganization of our business support functions, and (3) $22
million related to the closure of certain of our facilities. In fiscal year 2011, we anticipate incurring between $15
million and $20 million of restructuring charges related to the fiscal 2010 restructuring.
Overall, including charges incurred through March 31, 2010, we expect to incur total cash and non-cash charges
between $140 million and $145 million by March 31, 2012. These charges consist primarily of (1) employee-
related costs (approximately $65 million), (2) intangible asset impairment costs, abandoned rights to intellectual
property costs, and other costs to assist in the reorganization of our business support functions (approximately
$35 million), (3) facilities exit costs (approximately $25 million), and (4) other reorganizational costs including
IT and consulting costs (approximately $20 million).
Fiscal 2009 Restructuring
During fiscal year 2010, we incurred $14 million of restructuring charges, primarily for facilities-related
expenses. During fiscal year 2009, we incurred $41 million of restructuring charges, of which $32 million was
for employee-related expenses and $7 million was for facilities-related expenses. We do not expect to incur any
additional restructuring charges under this plan.
Fiscal 2008 Reorganization
During fiscal year 2010, we incurred $10 million of reorganization charges, primarily related to other expenses,
including contracted services costs to assist in the reorganization of our business support functions. During fiscal
45