Electronic Arts 2010 Annual Report Download - page 184
Download and view the complete annual report
Please find page 184 of the 2010 Electronic Arts annual report below. You can navigate through the pages in the report by either clicking on the pages listed below, or by using the keyword search tool below to find specific information within the annual report.-
 1
1 -
2
-
3
-
4
-
5
-
6
-
7
-
8
-
9
-
10
-
11
-
12
-
13
-
14
-
15
-
16
-
17
-
18
-
19
-
20
-
21
-
22
-
23
-
24
-
25
-
26
-
27
-
28
-
29
-
30
-
31
-
32
-
33
-
34
-
35
-
36
-
37
-
38
-
39
-
40
-
41
-
42
-
43
-
44
-
45
-
46
-
47
-
48
-
49
-
50
-
51
-
52
-
53
-
54
-
55
-
56
-
57
-
58
-
59
-
60
-
61
-
62
-
63
-
64
-
65
-
66
-
67
-
68
-
69
-
70
-
71
-
72
-
73
-
74
-
75
-
76
-
77
-
78
-
79
-
80
-
81
-
82
-
83
-
84
-
85
-
86
-
87
-
88
-
89
-
90
-
91
-
92
-
93
-
94
-
95
-
96
-
97
-
98
-
99
-
100
-
101
-
102
-
103
-
104
-
105
-
106
-
107
-
108
-
109
-
110
-
111
-
112
-
113
-
114
-
115
-
116
-
117
-
118
-
119
-
120
-
121
-
122
-
123
-
124
-
125
-
126
-
127
-
128
-
129
-
130
-
131
-
132
-
133
-
134
-
135
-
136
-
137
-
138
-
139
-
140
-
141
-
142
-
143
-
144
-
145
-
146
-
147
-
148
-
149
-
150
-
151
-
152
-
153
-
154
-
155
-
156
-
157
-
158
-
159
-
160
-
161
-
162
-
163
-
164
-
165
-
166
-
167
-
168
-
169
-
170
-
171
-
172
-
173
-
 174
174 -
 175
175 -
 176
176 -
 177
177 -
 178
178 -
 179
179 -
 180
180 -
 181
181 -
 182
182 -
 183
183 -
 184
184 -
 185
185 -
 186
186 -
 187
187 -
 188
188 -
 189
189 -
 190
190 -
 191
191 -
 192
192 -
 193
193 -
 194
194 -
195
-
196
-
197
-
198
-
199
-
200
 |
 |

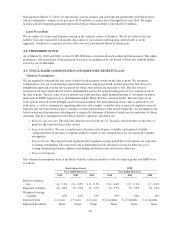
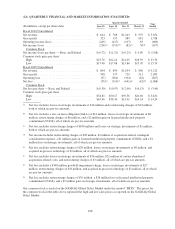
The following table summarizes the financial performance of the Label segment and a reconciliation of the Label
segment’s profit to our consolidated operating loss for the fiscal years ended March 31, 2010, 2009 and 2008 (in
millions):
Year Ended March 31,
2010 2009 2008
Label segment:
Net revenue before revenue deferral ................................... $3,692 $ 3,746 $ 3,722
Depreciation and amortization ........................................ (53) (67) (68)
Other expenses .................................................... (2,929) (3,284) (2,928)
Label segment profit ................................................. 710 395 726
Reconciliation to consolidated operating loss:
Other:
Revenue deferral .................................................. (2,358) (1,077) (1,186)
Recognition of revenue deferral ....................................... 1,853 1,203 831
Other net revenue .................................................. 467 340 298
Depreciation and amortization ........................................ (133) (121) (118)
Other expenses .................................................... (1,225) (1,567) (1,038)
Consolidated operating loss ............................................ $ (686) $ (827) $ (487)
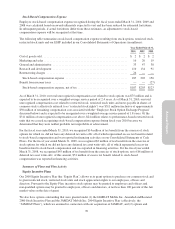
Label segment profit differs from consolidated operating loss primarily due to the exclusion of (1) certain
corporate and other functional costs that are not allocated to the Labels, (2) the deferral of certain net revenue
related to online-enabled packaged goods and digital content (see Note 9 of the Notes to Consolidated Financial
Statements), and (3) the results of EA Mobile, Pogo, Playfish, and our Switzerland distribution revenue that has
not been allocated to the Labels. Our CODM reviews assets on a consolidated basis and not on a segment basis.
Information about our total net revenue by platform for the fiscal years ended March 31, 2010, 2009 and 2008 is
presented below (in millions):
Year Ended March 31,
2010 2009 2008
Consoles
Xbox 360 ........................................................ $ 868 $1,005 $ 855
PLAYSTATION 3 ................................................. 771 776 383
Wii ............................................................. 570 583 307
PlayStation 2 ..................................................... 133 405 680
Xbox ............................................................ — 1 20
Nintendo GameCube ............................................... — — 6
Total Consoles .................................................. 2,342 2,770 2,251
PC ................................................................ 687 712 702
Wireless Platforms
Nintendo DS ...................................................... 135 222 235
Mobile .......................................................... 212 189 152
PSP ............................................................. 125 174 187
Game Boy Advance ................................................ — — 8
Total Wireless .................................................. 472 585 582
Licensing and Other .................................................. 153 145 130
Total Net Revenue ................................................... $3,654 $ 4,212 $ 3,665
106