Electronic Arts 2010 Annual Report Download - page 153
Download and view the complete annual report
Please find page 153 of the 2010 Electronic Arts annual report below. You can navigate through the pages in the report by either clicking on the pages listed below, or by using the keyword search tool below to find specific information within the annual report.-
 1
1 -
2
-
3
-
4
-
5
-
6
-
7
-
8
-
9
-
10
-
11
-
12
-
13
-
14
-
15
-
16
-
17
-
18
-
19
-
20
-
21
-
22
-
23
-
24
-
25
-
26
-
27
-
28
-
29
-
30
-
31
-
32
-
33
-
34
-
35
-
36
-
37
-
38
-
39
-
40
-
41
-
42
-
43
-
44
-
45
-
46
-
47
-
48
-
49
-
50
-
51
-
52
-
53
-
54
-
55
-
56
-
57
-
58
-
59
-
60
-
61
-
62
-
63
-
64
-
65
-
66
-
67
-
68
-
69
-
70
-
71
-
72
-
73
-
74
-
75
-
76
-
77
-
78
-
79
-
80
-
81
-
82
-
83
-
84
-
85
-
86
-
87
-
88
-
89
-
90
-
91
-
92
-
93
-
94
-
95
-
96
-
97
-
98
-
99
-
100
-
101
-
102
-
103
-
104
-
105
-
106
-
107
-
108
-
109
-
110
-
111
-
112
-
113
-
114
-
115
-
116
-
117
-
118
-
119
-
120
-
121
-
122
-
123
-
124
-
125
-
126
-
127
-
128
-
129
-
130
-
131
-
132
-
133
-
134
-
135
-
136
-
137
-
138
-
139
-
140
-
141
-
142
-
 143
143 -
 144
144 -
 145
145 -
 146
146 -
 147
147 -
 148
148 -
 149
149 -
 150
150 -
 151
151 -
 152
152 -
 153
153 -
 154
154 -
 155
155 -
 156
156 -
 157
157 -
 158
158 -
 159
159 -
 160
160 -
 161
161 -
 162
162 -
 163
163 -
164
-
165
-
166
-
167
-
168
-
169
-
170
-
171
-
172
-
173
-
174
-
175
-
176
-
177
-
178
-
179
-
180
-
181
-
182
-
183
-
184
-
185
-
186
-
187
-
188
-
189
-
190
-
191
-
192
-
193
-
194
-
195
-
196
-
197
-
198
-
199
-
200
 |
 |

Annual Report
addition, we monitor the volume of sales to our channel partners and their inventories as substantial overstocking
in the distribution channel could result in high returns or higher price protection costs in subsequent periods.
Similarly, significant judgment is required to estimate our allowance for doubtful accounts in any accounting
period. We analyze customer concentrations, customer credit-worthiness, current economic trends, and historical
experience when evaluating the adequacy of the allowance for doubtful accounts.
Advertising Costs
We generally expense advertising costs as incurred, except for production costs associated with media
campaigns, which are recognized as prepaid assets (to the extent paid in advance) and expensed at the first run of
the advertisement. Cooperative advertising costs are recognized when incurred and are included in marketing and
sales expense if there is a separate identifiable benefit for which we can reasonably estimate the fair value of the
benefit identified. Otherwise, they are recognized as a reduction of revenue and are generally accrued when
revenue is recognized. We then reimburse the channel partner when qualifying claims are submitted. For the
fiscal years ended March 31, 2010, 2009, and 2008, cooperative advertising costs totaled $160 million (of which
$146 million was recognized as a reduction to revenue), $150 million (of which $119 million was recognized as a
reduction to revenue), and $141 million (of which $104 million was recognized as a reduction to revenue),
respectively.
We are also reimbursed for advertising costs from our vendors, and such amounts are recognized as a reduction
of marketing and sales expense if the advertising (1) is specific to the vendor, (2) represents an identifiable
benefit to us, and (3) represents an incremental cost to us. Otherwise, vendor reimbursements are recognized as a
reduction of cost of goods sold as the related revenue is recognized. Vendor reimbursements of advertising costs
of $39 million, $31 million and $54 million reduced marketing and sales expense for the fiscal years ended
March 31, 2010, 2009 and 2008, respectively. For the fiscal years ended March 31, 2010, 2009 and 2008,
advertising expense, net of vendor reimbursements, totaled approximately $326 million, $270 million, and $234
million, respectively.
Software Development Costs
Research and development costs, which consist primarily of software development costs, are expensed as
incurred. We are required to capitalize certain software development costs incurred after technological feasibility
of the software is established or for development costs that have alternative future uses. Under our current
practice of developing new products, the technological feasibility of the underlying software is not established
until substantially all product development and testing is complete, which generally includes the development of
a working model. The software development costs that have been capitalized to date have been insignificant.
Stock-Based Compensation
We are required to estimate the fair value of share-based payment awards on the date of grant. We recognize
compensation costs for stock-based payment transactions to employees based on their grant-date fair value on a
straight-line approach over the service period for which such awards are expected to vest. The fair value of
restricted stock units and restricted stock is determined based on the quoted market price of our common stock on
the date of grant. The fair value of stock options and stock purchase rights granted pursuant to our equity
incentive plans and our 2000 Employee Stock Purchase Plan (“ESPP”), respectively, is determined using the
Black-Scholes valuation model. The fair value of our stock options is based on the multiple-award valuation
method. The determination of fair value is affected by our stock price, as well as assumptions regarding
subjective and complex variables such as expected employee exercise behavior and our expected stock price
volatility over the expected term of the award. Generally, our assumptions are based on historical information
and judgment is required to determine if historical trends may be indicators of future outcomes. The key
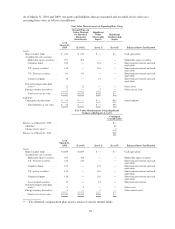
assumptions for the Black-Scholes valuation calculation are:
•Risk-free interest rate. The risk-free interest rate is based on U.S. Treasury yields in effect at the time of
grant for the expected term of the option.
75