Electronic Arts 2010 Annual Report Download - page 125
Download and view the complete annual report
Please find page 125 of the 2010 Electronic Arts annual report below. You can navigate through the pages in the report by either clicking on the pages listed below, or by using the keyword search tool below to find specific information within the annual report.-
 1
1 -
2
-
3
-
4
-
5
-
6
-
7
-
8
-
9
-
10
-
11
-
12
-
13
-
14
-
15
-
16
-
17
-
18
-
19
-
20
-
21
-
22
-
23
-
24
-
25
-
26
-
27
-
28
-
29
-
30
-
31
-
32
-
33
-
34
-
35
-
36
-
37
-
38
-
39
-
40
-
41
-
42
-
43
-
44
-
45
-
46
-
47
-
48
-
49
-
50
-
51
-
52
-
53
-
54
-
55
-
56
-
57
-
58
-
59
-
60
-
61
-
62
-
63
-
64
-
65
-
66
-
67
-
68
-
69
-
70
-
71
-
72
-
73
-
74
-
75
-
76
-
77
-
78
-
79
-
80
-
81
-
82
-
83
-
84
-
85
-
86
-
87
-
88
-
89
-
90
-
91
-
92
-
93
-
94
-
95
-
96
-
97
-
98
-
99
-
100
-
101
-
102
-
103
-
104
-
105
-
106
-
107
-
108
-
109
-
110
-
111
-
112
-
113
-
114
-
 115
115 -
 116
116 -
 117
117 -
 118
118 -
 119
119 -
 120
120 -
 121
121 -
 122
122 -
 123
123 -
 124
124 -
 125
125 -
 126
126 -
 127
127 -
 128
128 -
 129
129 -
 130
130 -
 131
131 -
 132
132 -
 133
133 -
 134
134 -
 135
135 -
136
-
137
-
138
-
139
-
140
-
141
-
142
-
143
-
144
-
145
-
146
-
147
-
148
-
149
-
150
-
151
-
152
-
153
-
154
-
155
-
156
-
157
-
158
-
159
-
160
-
161
-
162
-
163
-
164
-
165
-
166
-
167
-
168
-
169
-
170
-
171
-
172
-
173
-
174
-
175
-
176
-
177
-
178
-
179
-
180
-
181
-
182
-
183
-
184
-
185
-
186
-
187
-
188
-
189
-
190
-
191
-
192
-
193
-
194
-
195
-
196
-
197
-
198
-
199
-
200
 |
 |

Annual Report
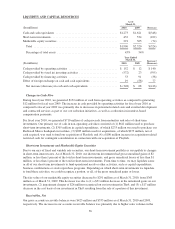
During the fiscal year ended March 31, 2010, losses on strategic investments, net decreased by $36 million, or 58
percent, as compared to the fiscal year ended March 31, 2009. We recognized a $26 million impairment charge
on our investment in The9 during the fiscal year ended March 31, 2010.
During the fiscal year ended March 31, 2009, we recognized (1) $40 million of impairment charges on our
investments in Neowiz’s common and preferred shares and (2) a $27 million impairment charge on our
investment in The9. These charges were offset by a $5 million dividend received from our investment in The9.
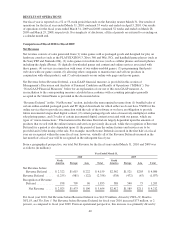
Interest and Other Income, Net
Interest and other income, net, for fiscal years 2010 and 2009 were as follows (in millions):
March 31,
2010
% of Net
Revenue
March 31,
2009
% of Net
Revenue $ Change % Change
$6 — $34 1% $(28) (82%)
For fiscal year 2010, interest and other income, net, decreased by $28 million, or 82 percent, as compared to
fiscal year 2009, primarily due to a decrease in interest income resulting from lower yields and balances on our
cash and cash equivalents and short-term investments.
Income Taxes
Income tax provision (benefit) for fiscal years 2010 and 2009 were as follows (in millions):
March 31,
2010
Effective
Tax Rate
March 31,
2009
Effective
Tax Rate % Change
$(29) (4.1%) $233 27.2% (112%)
Our effective income tax rate was a tax benefit of 4.1 percent for fiscal year 2010. Our effective income tax rate
was 27.2 percent for fiscal year 2009. In fiscal year 2010, our effective tax rate differed from the U.S. statutory
tax rate of 35.0 percent due primarily to U.S. losses for which no benefit is recognized, tax charges related to our
integration of Playfish, non-U.S. losses with a reduced or zero tax benefit and non-deductible stock-based
compensation expenses, partially offset by benefits related to the resolution of examinations by taxing authorities
and reductions in the valuation allowance on U.S. deferred tax assets. In fiscal year 2009, we recorded a tax
provision instead of a tax benefit on the pre-tax loss due primarily to the deferred tax valuation allowance. Our
effective tax rate in fiscal 2009 differed from the U.S. statutory tax rate of 35.0 percent due primarily to the
deferred tax valuation allowance, non-deductible goodwill impairment, non-deductible stock-based
compensation expenses, non-deductible losses on strategic investments, losses in jurisdictions with tax rates
lower than the U.S. rate of 35.0 percent, and a loss on facility impairment for which the future tax benefit is
uncertain and not more likely than not to be realized.
Our effective income tax rates for fiscal year 2011 and future periods will depend on a variety of factors,
including changes in the deferred tax valuation allowance, as well as changes in our business such as acquisitions
and intercompany transactions, changes in our international structure, changes in the geographic location of
business functions or assets, changes in the geographic mix of income, changes in or termination of our
agreements with tax authorities, applicable accounting rules, applicable tax laws and regulations, rulings and
interpretations thereof, developments in tax audit and other matters, and variations in our annual pre-tax income
or loss. We incur certain tax expenses that do not decline proportionately with declines in our pre-tax
consolidated income or loss. As a result, in absolute dollar terms, our tax provision will have a greater influence
on our effective tax rate at lower levels of pre-tax income or loss than at higher levels. In addition, at lower levels
of pre-tax income or loss, our effective tax rate will be more volatile.
Certain taxable temporary differences that are not expected to reverse during the carry forward periods permitted
by tax law cannot be considered as a source of future taxable income that may be available to realize the benefit
47