General Motors 2013 Annual Report Download - page 100
Download and view the complete annual report
Please find page 100 of the 2013 General Motors annual report below. You can navigate through the pages in the report by either clicking on the pages listed below, or by using the keyword search tool below to find specific information within the annual report.-
 1
1 -
2
-
3
-
4
-
5
-
6
-
7
-
8
-
9
-
10
-
11
-
12
-
13
-
14
-
15
-
16
-
17
-
18
-
19
-
20
-
21
-
22
-
23
-
24
-
25
-
26
-
27
-
28
-
29
-
30
-
31
-
32
-
33
-
34
-
35
-
36
-
37
-
38
-
39
-
40
-
41
-
42
-
43
-
44
-
45
-
46
-
47
-
48
-
49
-
50
-
51
-
52
-
53
-
54
-
55
-
56
-
57
-
58
-
59
-
60
-
61
-
62
-
63
-
64
-
65
-
66
-
67
-
68
-
69
-
70
-
71
-
72
-
73
-
74
-
75
-
76
-
77
-
78
-
79
-
80
-
81
-
82
-
83
-
84
-
85
-
86
-
87
-
88
-
89
-
 90
90 -
 91
91 -
 92
92 -
 93
93 -
 94
94 -
 95
95 -
 96
96 -
 97
97 -
 98
98 -
 99
99 -
 100
100 -
 101
101 -
 102
102 -
 103
103 -
 104
104 -
 105
105 -
 106
106 -
 107
107 -
 108
108 -
 109
109 -
 110
110 -
111
-
112
-
113
-
114
-
115
-
116
-
117
-
118
-
119
-
120
-
121
-
122
-
123
-
124
-
125
-
126
-
127
-
128
-
129
-
130
 |
 |

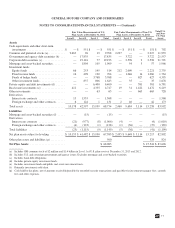
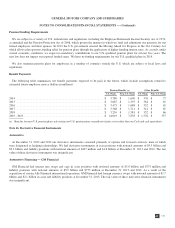
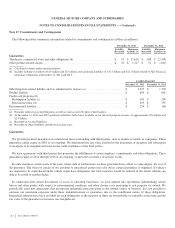
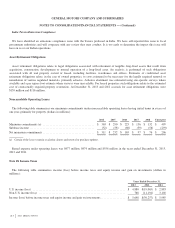
GENERAL MOTORS COMPANY AND SUBSIDIARIES
NOTES TO CONSOLIDATED FINANCIAL STATEMENTS — (Continued)
Target Allocation Percentages
The following table summarizes the target allocations by asset category for U.S. and non-U.S. defined benefit pension plans:
December 31, 2013 December 31, 2012
U.S. Plans Non-U.S. Plans U.S. Plans Non-U.S. Plans
Asset Categories
Equity ........................................................... 19% 28% 19% 30%
Debt ............................................................. 58% 49% 60% 53%
Other (a) .......................................................... 23% 23% 21% 17%
Total ............................................................. 100% 100% 100% 100%
(a) Primarily includes private equity, real estate and absolute return strategies which mainly consist of hedge funds.
Assets and Fair Value Measurements
The following tables summarize the fair value of defined benefit pension plan assets by asset class (dollars in millions):
Fair Value Measurements of U.S. Plan Assets at
December 31, 2013
Fair Value Measurements of Non-U.S. Plan
Assets at December 31, 2013
Total U.S.
and Non-
U.S. Plan
AssetsLevel 1 Level 2 Level 3 Total Level 1 Level 2 Level 3 Total
Assets
Cash equivalents and other short-term
investments ...................... $ — $ 411 $ — $ 411 $ — $ 156 $ — $ 156 $ 567
Common and preferred stocks (a) ....... 10,234 70 6 10,310 1,816 6 — 1,822 12,132
Government and agency debt
securities (b) ...................... — 14,971 — 14,971 — 3,418 — 3,418 18,389
Corporate debt securities (c) ........... — 20,409 58 20,467 — 2,410 12 2,422 22,889
Mortgage and asset-backed securities .... — 238 72 310 — 65 2 67 377
Investment funds
Equity funds ...................... 72 190 44 306 128 1,930 — 2,058 2,364
Fixed income funds ................ 27 8 113 148 — 927 12 939 1,087
Funds of hedge funds ............... — — 4,285 4,285 — — 733 733 5,018
Other investment funds ............. — 820 732 1,552 — 672 — 672 2,224
Private equity and debt investments (d) . . . — — 6,335 6,335 — — 430 430 6,765
Real estate investments (e) ............ 390 4 4,127 4,521 13 12 1,405 1,430 5,951
Other investments ...................——6262——618618680
Derivatives
Interest rate contracts ............... 5 46 — 51 1 1 — 2 53
Foreign exchange and other
contracts ....................... 12 111 — 123 2 43 — 45 168
Total assets ......................... 10,740 37,278 15,834 63,852 1,960 9,640 3,212 14,812 78,664
Liabilities
Derivatives
Interest rate contracts ............... (22) (213) (6) (241) (12) — — (12) (253)
Foreign exchange and other
contracts ....................... — (98) — (98) — (56) — (56) (154)
Total liabilities ...................... (22) (311) (6) (339) (12) (56) — (68) (407)
Net plan assets subject to leveling ....... $ 10,718 $ 36,967 $ 15,828 63,513 $ 1,948 $ 9,584 $ 3,212 14,744 78,257
Other plan assets and liabilities (g) ...... 653 242 895
Net Plan Assets ..................... $ 64,166 $ 14,986 $ 79,152
98
2013 ANNUAL REPORT