General Motors 2013 Annual Report Download - page 79
Download and view the complete annual report
Please find page 79 of the 2013 General Motors annual report below. You can navigate through the pages in the report by either clicking on the pages listed below, or by using the keyword search tool below to find specific information within the annual report.-
 1
1 -
2
-
3
-
4
-
5
-
6
-
7
-
8
-
9
-
10
-
11
-
12
-
13
-
14
-
15
-
16
-
17
-
18
-
19
-
20
-
21
-
22
-
23
-
24
-
25
-
26
-
27
-
28
-
29
-
30
-
31
-
32
-
33
-
34
-
35
-
36
-
37
-
38
-
39
-
40
-
41
-
42
-
43
-
44
-
45
-
46
-
47
-
48
-
49
-
50
-
51
-
52
-
53
-
54
-
55
-
56
-
57
-
58
-
59
-
60
-
61
-
62
-
63
-
64
-
65
-
66
-
67
-
68
-
 69
69 -
 70
70 -
 71
71 -
 72
72 -
 73
73 -
 74
74 -
 75
75 -
 76
76 -
 77
77 -
 78
78 -
 79
79 -
 80
80 -
 81
81 -
 82
82 -
 83
83 -
 84
84 -
 85
85 -
 86
86 -
 87
87 -
 88
88 -
 89
89 -
90
-
91
-
92
-
93
-
94
-
95
-
96
-
97
-
98
-
99
-
100
-
101
-
102
-
103
-
104
-
105
-
106
-
107
-
108
-
109
-
110
-
111
-
112
-
113
-
114
-
115
-
116
-
117
-
118
-
119
-
120
-
121
-
122
-
123
-
124
-
125
-
126
-
127
-
128
-
129
-
130
 |
 |

GENERAL MOTORS COMPANY AND SUBSIDIARIES
NOTES TO CONSOLIDATED FINANCIAL STATEMENTS — (Continued)
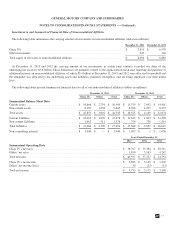
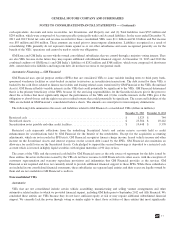
Investment in and Summarized Financial Data of Nonconsolidated Affiliates
The following table summarizes the carrying amount of investments in nonconsolidated affiliates (dollars in millions):
December 31, 2013 December 31, 2012
China JVs ..................................................................... $ 7,851 $ 6,579
Other investments ............................................................... 243 304
Total equity in net assets of nonconsolidated affiliates .................................. $ 8,094 $ 6,883
At December 31, 2013 and 2012 the carrying amount of our investments in certain joint ventures exceeded our share of the
underlying net assets by $3.8 billion. These differences are primarily related to the application of fresh-start reporting and purchase of
additional interests in nonconsolidated affiliates, of which $3.4 billion at December 31, 2013 and 2012 were allocated to goodwill and
the remainder was allocated to the underlying assets and liabilities, primarily intangibles, and are being amortized over their useful
lives.
The following tables present summarized financial data for all of our nonconsolidated affiliates (dollars in millions):
December 31, 2013 December 31, 2012
China JVs Others Total China JVs Others Total
Summarized Balance Sheet Data
Current assets .................................. $ 14,666 $ 2,234 $ 16,900 $ 11,759 $ 2,642 $ 14,401
Non-current assets ............................... 8,187 1,458 9,645 6,766 1,507 8,273
Total assets .................................... $ 22,853 $ 3,692 $ 26,545 $ 18,525 $ 4,149 $ 22,674
Current liabilities ............................... $ 14,019 $ 1,859 $ 15,878 $ 12,612 $ 1,893 $ 14,505
Non-current liabilities ............................ 1,065 511 1,576 756 758 1,514
Total liabilities ................................. $ 15,084 $ 2,370 $ 17,454 $ 13,368 $ 2,651 $ 16,019
Non-controlling interests ......................... $ 1,040 $ — $ 1,040 $ 1,055 $ 1 $ 1,056
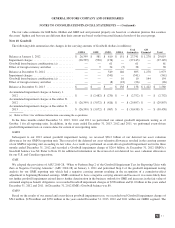
Years Ended December 31,
2013 2012 2011
Summarized Operating Data
China JV’s net sales ............................................................ $ 38,767 $ 33,364 $ 30,511
Others’ net sales ............................................................... 1,830 3,963 4,242
Total net sales ................................................................ $ 40,597 $ 37,327 $ 34,753
China JV’s net income .......................................................... $ 3,685 $ 3,198 $ 3,203
Others’ net income (loss) ........................................................ 50 (23) (13)
Total net income .............................................................. $ 3,735 $ 3,175 $ 3,190
77