General Motors 2013 Annual Report Download - page 31
Download and view the complete annual report
Please find page 31 of the 2013 General Motors annual report below. You can navigate through the pages in the report by either clicking on the pages listed below, or by using the keyword search tool below to find specific information within the annual report.-
 1
1 -
2
-
3
-
4
-
5
-
6
-
7
-
8
-
9
-
10
-
11
-
12
-
13
-
14
-
15
-
16
-
17
-
18
-
19
-
20
-
 21
21 -
 22
22 -
 23
23 -
 24
24 -
 25
25 -
 26
26 -
 27
27 -
 28
28 -
 29
29 -
 30
30 -
 31
31 -
 32
32 -
 33
33 -
 34
34 -
 35
35 -
 36
36 -
 37
37 -
 38
38 -
 39
39 -
 40
40 -
 41
41 -
42
-
43
-
44
-
45
-
46
-
47
-
48
-
49
-
50
-
51
-
52
-
53
-
54
-
55
-
56
-
57
-
58
-
59
-
60
-
61
-
62
-
63
-
64
-
65
-
66
-
67
-
68
-
69
-
70
-
71
-
72
-
73
-
74
-
75
-
76
-
77
-
78
-
79
-
80
-
81
-
82
-
83
-
84
-
85
-
86
-
87
-
88
-
89
-
90
-
91
-
92
-
93
-
94
-
95
-
96
-
97
-
98
-
99
-
100
-
101
-
102
-
103
-
104
-
105
-
106
-
107
-
108
-
109
-
110
-
111
-
112
-
113
-
114
-
115
-
116
-
117
-
118
-
119
-
120
-
121
-
122
-
123
-
124
-
125
-
126
-
127
-
128
-
129
-
130
 |
 |

GENERAL MOTORS COMPANY AND SUBSIDIARIES
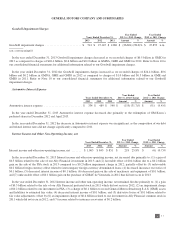
GME Total Net Sales and Revenue and EBIT (Loss)-Adjusted
Years Ended December 31,
Year Ended
2013 vs. 2012 Change Variance Due To
2013 2012
Favorable/
(Unfavorable) % Volume Mix Price Other Total
(Dollars in millions) (Dollars in billions)
Total net sales and revenue ........ $ 20,110 $ 20,689 $ (579) (2.8)% $ (0.6) $ — $ (0.2) $ 0.2 $ (0.6)
EBIT (loss)-adjusted ............. $ (844) $ (1,939) $ 1,095 (56.5)% $ (0.1) $ (0.2) $ (0.2) $ 1.6 $ 1.1
(Vehicles in thousands)
Wholesale vehicle sales .......... 1,047 1,079 (32) (3.0)%
Years Ended December 31,
Year Ended
2012 vs. 2011 Change Variance Due To
2012 2011
Favorable/
(Unfavorable) % Volume Mix Price Other Total
(Dollars in millions) (Dollars in billions)
Total net sales and revenue ........ $ 20,689 $ 25,154 $ (4,465) (17.8)% $ (2.4) $ 0.4 $ (0.2) $ (2.3) $ (4.5)
EBIT (loss)-adjusted ............. $ (1,939) $ (1,041) $ (898) 86.3% $ (0.5) $ (0.4) $ (0.2) $ 0.2 $ (0.9)
(Vehicles in thousands)
Wholesale vehicle sales ........... 1,079 1,240 (161) (13.0)%
GME Total Net Sales and Revenue
In the year ended December 31, 2013 Total net sales and revenue decreased due primarily to: (1) decreased wholesale volumes due
to the weak European economy; and (2) unfavorable vehicle pricing primarily resulting from increased incentive support associated
with difficult market conditions; partially offset by (3) Other of $0.2 billion due primarily to favorable net foreign currency effect.
In the year ended December 31, 2012 Total net sales and revenue decreased due primarily to: (1) decreased wholesale volumes due
to the weak European economy; (2) unfavorable price effects primarily resulting from increased incentive support associated with
strong competition; and (3) Other of $2.3 billion due primarily to unfavorable net foreign currency effect of $1.7 billion resulting from
the strengthening of the U.S. Dollar against the Euro, Russian Ruble, Hungarian Forint, Turkish Lira and British Pound; decreased
parts, accessories and powertrain engine and transmission sales of $0.5 billion associated with lower demand; and a decrease of $0.1
billion due to the deconsolidation of VMM in June 2011; partially offset by (4) favorable vehicle mix due to the new generation Astra
GTC, Opel Mokka and Ampera and increased sales of other higher priced vehicles.
GME EBIT (Loss)-Adjusted
In the year ended December 31, 2013 EBIT (loss)-adjusted decreased due primarily to: (1) Other of $1.6 billion due primarily to
decreased manufacturing costs of $0.7 billion mainly resulting from decreased depreciation expense because of asset impairments in
December 2012, which decreased the depreciable base; decreased engineering expenses of $0.3 billion; favorable material and freight
costs of $0.3 billion; and a favorable net effect of changes in the fair value of an embedded foreign currency derivative asset of $0.2
billion associated with a long-term supply agreement; partially offset by (2) unfavorable net vehicle mix due to lower proportion of
higher priced vehicles; (3) unfavorable vehicle pricing; and (4) decreased wholesale volumes.
In the year ended December 31, 2012 EBIT (loss)-adjusted increased due primarily to: (1) decreased wholesale volumes;
(2) unfavorable net vehicle mix; and (3) unfavorable price effects; partially offset by (4) Other of $0.2 billion due primarily to lower
manufacturing and material costs of $0.4 billion; and favorable net foreign currency effect of $0.1 billion resulting from the
strengthening of the U.S. Dollar against the Euro, Russian Ruble, Hungarian Forint, Turkish Lira, and British Pound; partially offset
by a decrease of $0.2 billion resulting from the net effect of changes in an embedded foreign currency derivative asset associated with
a long-term supply agreement; and decreased parts, accessories and powertrain engine and transmission sales of $0.2 billion,
associated with lower demand.
29