General Motors 2013 Annual Report Download - page 101
Download and view the complete annual report
Please find page 101 of the 2013 General Motors annual report below. You can navigate through the pages in the report by either clicking on the pages listed below, or by using the keyword search tool below to find specific information within the annual report.-
 1
1 -
2
-
3
-
4
-
5
-
6
-
7
-
8
-
9
-
10
-
11
-
12
-
13
-
14
-
15
-
16
-
17
-
18
-
19
-
20
-
21
-
22
-
23
-
24
-
25
-
26
-
27
-
28
-
29
-
30
-
31
-
32
-
33
-
34
-
35
-
36
-
37
-
38
-
39
-
40
-
41
-
42
-
43
-
44
-
45
-
46
-
47
-
48
-
49
-
50
-
51
-
52
-
53
-
54
-
55
-
56
-
57
-
58
-
59
-
60
-
61
-
62
-
63
-
64
-
65
-
66
-
67
-
68
-
69
-
70
-
71
-
72
-
73
-
74
-
75
-
76
-
77
-
78
-
79
-
80
-
81
-
82
-
83
-
84
-
85
-
86
-
87
-
88
-
89
-
90
-
 91
91 -
 92
92 -
 93
93 -
 94
94 -
 95
95 -
 96
96 -
 97
97 -
 98
98 -
 99
99 -
 100
100 -
 101
101 -
 102
102 -
 103
103 -
 104
104 -
 105
105 -
 106
106 -
 107
107 -
 108
108 -
 109
109 -
 110
110 -
 111
111 -
112
-
113
-
114
-
115
-
116
-
117
-
118
-
119
-
120
-
121
-
122
-
123
-
124
-
125
-
126
-
127
-
128
-
129
-
130
 |
 |

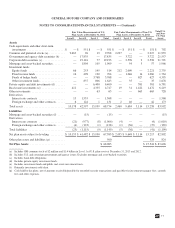
GENERAL MOTORS COMPANY AND SUBSIDIARIES
NOTES TO CONSOLIDATED FINANCIAL STATEMENTS — (Continued)
Fair Value Measurements of U.S.
Plan Assets at December 31, 2012
Fair Value Measurements of Non-U.S.
Plan Assets at December 31, 2012
Total U.S.
and Non-
U.S. Plan
AssetsLevel 1 Level 2 Level 3 Total Level 1 Level 2 Level 3 Total
Assets
Cash equivalents and other short-term
investments ..........................$ —$ 551$ —$ 551$ —$ 151$ —$ 151$ 702
Common and preferred stocks (a) ........... 9,663 26 19 9,708 2,227 — — 2,227 11,935
Government and agency debt securities (b) . . . — 17,835 — 17,835 — 3,722 — 3,722 21,557
Corporate debt securities (c) ............... — 19,116 77 19,193 — 2,596 2 2,598 21,791
Mortgage and asset-backed securities ........ — 1,804 105 1,909 — 54 3 57 1,966
Investment funds
Equity funds ......................... 66 253 195 514 212 2,009 — 2,221 2,735
Fixed income funds .................... 16 498 190 704 — 1,046 14 1,060 1,764
Funds of hedge funds .................. — — 3,768 3,768 — — 627 627 4,395
Other investment funds ................. — 837 806 1,643 — 35 — 35 1,678
Private equity and debt investments (d) ...... — — 6,400 6,400 — — 381 381 6,781
Real estate investments (e) ................ 412 — 4,335 4,747 19 31 1,422 1,472 6,219
Other investments .......................——6363——665665728
Derivatives
Interest rate contracts .................. 15 1,553 — 1,568——— —1,568
Foreign exchange and other contracts ...... 6 124 1 131 2 40 — 42 173
Total assets ............................ 10,178 42,597 15,959 68,734 2,460 9,684 3,114 15,258 83,992
Liabilities
Mortgage and asset-backed securities (f) ..... — (15) — (15) — — — — (15)
Derivatives
Interest rate contracts .................. (21) (977) (8) (1,006) (4) — — (4) (1,010)
Foreign exchange and other contracts ...... (4) (123) (1) (128) (1) (36) — (37) (165)
Total liabilities ......................... (25) (1,115) (9) (1,149) (5) (36) — (41) (1,190)
Net plan assets subject to leveling ..........$ 10,153 $ 41,482 $ 15,950 67,585 $ 2,455 $ 9,648 $ 3,114 15,217 82,802
Other plan assets and liabilities (g) .......... 500 324 824
Net Plan Assets ........................ $ 68,085 $ 15,541 $ 83,626
(a) Includes GM common stock of $2 million and $1.4 billion in Level 1 of U.S. plan assets at December 31, 2013 and 2012.
(b) Includes U.S. and sovereign government and agency issues. Excludes mortgage and asset-backed securities.
(c) Includes bank debt obligations.
(d) Includes private equity investment funds.
(e) Includes investment funds and public real estate investment trusts.
(f) Primarily investments sold short.
(g) Cash held by the plans, net of amounts receivable/payable for unsettled security transactions and payables for investment manager fees, custody
fees and other expenses.
99