General Motors 2013 Annual Report Download - page 76
Download and view the complete annual report
Please find page 76 of the 2013 General Motors annual report below. You can navigate through the pages in the report by either clicking on the pages listed below, or by using the keyword search tool below to find specific information within the annual report.-
 1
1 -
2
-
3
-
4
-
5
-
6
-
7
-
8
-
9
-
10
-
11
-
12
-
13
-
14
-
15
-
16
-
17
-
18
-
19
-
20
-
21
-
22
-
23
-
24
-
25
-
26
-
27
-
28
-
29
-
30
-
31
-
32
-
33
-
34
-
35
-
36
-
37
-
38
-
39
-
40
-
41
-
42
-
43
-
44
-
45
-
46
-
47
-
48
-
49
-
50
-
51
-
52
-
53
-
54
-
55
-
56
-
57
-
58
-
59
-
60
-
61
-
62
-
63
-
64
-
65
-
 66
66 -
 67
67 -
 68
68 -
 69
69 -
 70
70 -
 71
71 -
 72
72 -
 73
73 -
 74
74 -
 75
75 -
 76
76 -
 77
77 -
 78
78 -
 79
79 -
 80
80 -
 81
81 -
 82
82 -
 83
83 -
 84
84 -
 85
85 -
 86
86 -
87
-
88
-
89
-
90
-
91
-
92
-
93
-
94
-
95
-
96
-
97
-
98
-
99
-
100
-
101
-
102
-
103
-
104
-
105
-
106
-
107
-
108
-
109
-
110
-
111
-
112
-
113
-
114
-
115
-
116
-
117
-
118
-
119
-
120
-
121
-
122
-
123
-
124
-
125
-
126
-
127
-
128
-
129
-
130
 |
 |

GENERAL MOTORS COMPANY AND SUBSIDIARIES
NOTES TO CONSOLIDATED FINANCIAL STATEMENTS — (Continued)
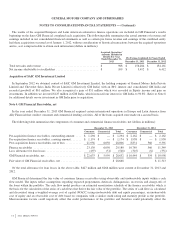
Sales proceeds from investments classified as available-for-sale and sold prior to maturity were $4.7 billion, $4.7 billion and $1.6
billion in the years ended December 31, 2013, 2012 and 2011.
The following table summarizes the amortized cost and the fair value of investments classified as available-for-sale by contractual
maturity at December 31, 2013 (dollars in millions):
Amortized Cost Fair Value
Due in one year or less .................................................................. $ 14,879 $ 14,881
Due after one year through five years ...................................................... 1,937 1,939
Total contractual maturities of available-for-sale securities ..................................... $ 16,816 $ 16,820
Cumulative unrealized gains and losses on available-for-sale securities and net unrealized gains (losses) on trading securities were
insignificant at and in the years ended December 31, 2013, 2012 and 2011.
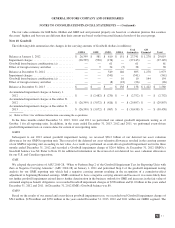
Peugeot S.A.
In December 2013 we sold our seven percent investment in Peugeot S. A. (PSA) common stock for $339 million, net of disposal
costs and we recorded a net gain of $152 million in Interest income and other non-operating income, net.
At December 31, 2012 we measured the fair value of our investment in PSA common stock using the published stock price and
determined the carrying amount of our investment in PSA common stock exceeded its fair value. PSA’s stock price had shown no
sustained signs of recovery towards the price at which we acquired it in March 2012. Based upon the 55% decline in PSA common
stock price since our acquisition and the nine month duration of the impairment, combined with our fourth quarter reassessment of our
European automotive operations, we concluded that the impairment of our investment in PSA common stock was other-than-
temporary. As a result we transferred the total unrealized losses from Accumulated other comprehensive loss to Interest income and
other non-operating income, net resulting in an impairment charge of $220 million.
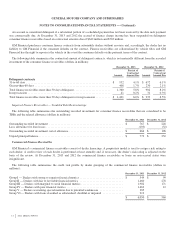
Note 6. Inventories
The following table summarizes the components of Inventories (dollars in millions):
December 31, 2013 December 31, 2012
Productive material, supplies and work in process ...................................... $ 5,872 $ 6,560
Finished product, including service parts ............................................. 8,167 8,154
Total inventories ................................................................ $ 14,039 $ 14,714
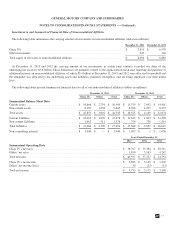
Note 7. Equipment on Operating Leases, net
Automotive
Equipment on operating leases, net is composed of vehicle sales to daily rental car companies. The following table summarizes
information related to Equipment on operating leases, net (dollars in millions):
December 31, 2013 December 31, 2012
Equipment on operating leases ..................................................... $ 2,605 $ 1,946
Less: accumulated depreciation .................................................... (207) (164)
Equipment on operating leases, net .................................................. $ 2,398 $ 1,782
74
2013 ANNUAL REPORT