General Motors 2013 Annual Report Download - page 22
Download and view the complete annual report
Please find page 22 of the 2013 General Motors annual report below. You can navigate through the pages in the report by either clicking on the pages listed below, or by using the keyword search tool below to find specific information within the annual report.-
 1
1 -
2
-
3
-
4
-
5
-
6
-
7
-
8
-
9
-
10
-
11
-
 12
12 -
 13
13 -
 14
14 -
 15
15 -
 16
16 -
 17
17 -
 18
18 -
 19
19 -
 20
20 -
 21
21 -
 22
22 -
 23
23 -
 24
24 -
 25
25 -
 26
26 -
 27
27 -
 28
28 -
 29
29 -
 30
30 -
 31
31 -
 32
32 -
33
-
34
-
35
-
36
-
37
-
38
-
39
-
40
-
41
-
42
-
43
-
44
-
45
-
46
-
47
-
48
-
49
-
50
-
51
-
52
-
53
-
54
-
55
-
56
-
57
-
58
-
59
-
60
-
61
-
62
-
63
-
64
-
65
-
66
-
67
-
68
-
69
-
70
-
71
-
72
-
73
-
74
-
75
-
76
-
77
-
78
-
79
-
80
-
81
-
82
-
83
-
84
-
85
-
86
-
87
-
88
-
89
-
90
-
91
-
92
-
93
-
94
-
95
-
96
-
97
-
98
-
99
-
100
-
101
-
102
-
103
-
104
-
105
-
106
-
107
-
108
-
109
-
110
-
111
-
112
-
113
-
114
-
115
-
116
-
117
-
118
-
119
-
120
-
121
-
122
-
123
-
124
-
125
-
126
-
127
-
128
-
129
-
130
 |
 |

GENERAL MOTORS COMPANY AND SUBSIDIARIES
Automotive Outlook
We anticipate the 2014 global automotive industry to be up approximately 2% over 2013 or about 85 million vehicles. For 2014 we
expect our biggest challenges will be associated with unfavorable foreign currency pressures and planned global restructuring charges
of up to $1.1 billion. However we expect to substantially offset these challenges with favorable pricing and by leveraging our
continued strength in North America and China. We continue to progress toward our target of mid- to high-single digit margins for
mid-decade and expect our 2014 EBIT-adjusted margins to be comparable to 2013. We are also committed to returning capital to our
common stockholders and in January 2014 our Board of Directors declared a dividend on common stock in the amount of $0.30 per
share payable in March 2014.
Automotive Financing — GM Financial
GM Financial purchases automobile finance contracts originated by GM and non-GM franchised and select independent dealers in
connection with the sale of used and new automobiles. GM Financial also offers a lease financing product for new GM vehicles and a
commercial lending program for GM-franchised dealerships. GM Financial’s lending products in North America are primarily offered
to consumers who typically are unable to obtain financing from traditional sources such as banks and credit unions. GM Financial
utilizes a proprietary credit scoring system to differentiate credit applications and to statistically rank-order credit risk in terms of
expected default rates, which enables it to evaluate credit applications for approval and tailor loan and lease pricing and structure. GM
Financial services its loan and lease portfolios at regional centers using automated servicing and collection systems. Funding for our
auto finance activities is primarily obtained through the utilization of our credit facilities and through securitization transactions.
In November 2012 GM Financial entered into agreements with Ally Financial to acquire Ally Financial’s automotive finance and
financial services businesses in Europe and Latin America and Ally Financial’s equity interest in GMAC-SAIC Automotive Finance
Company Limited (GMAC-SAIC) that conducts automotive finance and financial services operations in China. The acquisitions will
allow GM Financial to support our dealers in markets comprising approximately 80% of our global sales. In the year ended
December 31, 2013 GM Financial completed the acquisitions of the operations in Europe and Latin America for $3.3 billion. GM
Financial’s acquisition of Ally Financial’s equity interest in GMAC-SAIC is subject to certain regulatory and other approvals and is
expected to close in 2014 for approximately $0.9 billion. Refer to Note 3 to our consolidated financial statements for additional
information on these acquisitions.
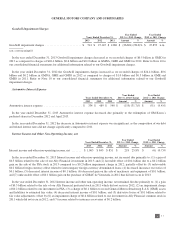
Consolidated Results
Total Net Sales and Revenue
(Dollars in Millions)
Years Ended December 31,
Year Ended
2013 vs. 2012 Change Variance Due To
2013 2012
Favorable/
(Unfavorable) % Volume Mix Price Other Total
(Dollars in millions) (Dollars in billions)
Automotive ..................... $ 152,092 $ 150,295 $ 1,797 1.2% $ (0.2) $ 1.7 $ 2.2 $ (1.9) $ 1.8
GM Financial .................... 3,335 1,961 1,374 70.1% — — — 1.4 1.4
Total net sales and revenue ......... $ 155,427 $ 152,256 $ 3,171 2.1% $ (0.2) $ 1.7 $ 2.2 $ (0.5) $ 3.2
Years Ended December 31,
Year Ended
2012 vs. 2011 Change Variance Due To
2012 2011
Favorable/
(Unfavorable) % Volume Mix Price Other Total
(Dollars in millions) (Dollars in billions)
Automotive ..................... $ 150,295 $ 148,866 $ 1,429 1.0% $ 2.1 $ 3.0 $ 1.6 $ (5.3) $ 1.4
GM Financial .................... 1,961 1,410 551 39.1% — — — 0.6 0.6
Total net sales and revenue ......... $ 152,256 $ 150,276 $ 1,980 1.3% $ 2.1 $ 3.0 $ 1.6 $ (4.7) $ 2.0
20
2013 ANNUAL REPORT