General Motors 2013 Annual Report Download - page 39
Download and view the complete annual report
Please find page 39 of the 2013 General Motors annual report below. You can navigate through the pages in the report by either clicking on the pages listed below, or by using the keyword search tool below to find specific information within the annual report.-
 1
1 -
2
-
3
-
4
-
5
-
6
-
7
-
8
-
9
-
10
-
11
-
12
-
13
-
14
-
15
-
16
-
17
-
18
-
19
-
20
-
21
-
22
-
23
-
24
-
25
-
26
-
27
-
28
-
 29
29 -
 30
30 -
 31
31 -
 32
32 -
 33
33 -
 34
34 -
 35
35 -
 36
36 -
 37
37 -
 38
38 -
 39
39 -
 40
40 -
 41
41 -
 42
42 -
 43
43 -
 44
44 -
 45
45 -
 46
46 -
 47
47 -
 48
48 -
 49
49 -
50
-
51
-
52
-
53
-
54
-
55
-
56
-
57
-
58
-
59
-
60
-
61
-
62
-
63
-
64
-
65
-
66
-
67
-
68
-
69
-
70
-
71
-
72
-
73
-
74
-
75
-
76
-
77
-
78
-
79
-
80
-
81
-
82
-
83
-
84
-
85
-
86
-
87
-
88
-
89
-
90
-
91
-
92
-
93
-
94
-
95
-
96
-
97
-
98
-
99
-
100
-
101
-
102
-
103
-
104
-
105
-
106
-
107
-
108
-
109
-
110
-
111
-
112
-
113
-
114
-
115
-
116
-
117
-
118
-
119
-
120
-
121
-
122
-
123
-
124
-
125
-
126
-
127
-
128
-
129
-
130
 |
 |

GENERAL MOTORS COMPANY AND SUBSIDIARIES
these facilities, but have amounts in use under the letter of credit sub-facility of $0.6 billion at December 31, 2013. GM Financial has
not borrowed against the three-year facility. Refer to Note 14 to our consolidated financial statements for additional details on our
secured revolving credit facilities.
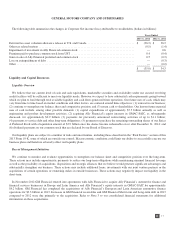
The following table summarizes our automotive available liquidity (dollars in millions):
December 31, 2013 December 31, 2012
Cash and cash equivalents ......................................................... $ 18,947 $ 17,133
Marketable securities ............................................................ 8,972 8,988
Available liquidity ............................................................. 27,919 26,121
Available under credit facilities .................................................... 10,404 11,119
Total available liquidity ........................................................ $ 38,323 $ 37,240
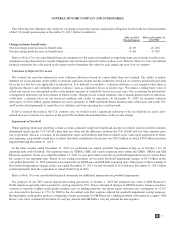
The following table summarizes the changes in our automotive available liquidity (dollars in billions):
Year Ended
2013 vs 2012
Operating cash flow ................................................................................. $ 11.0
Less: capital expenditures ............................................................................ (7.5)
Sale of investments in Ally Financial and PSA ............................................................ 1.2
Capital contribution to GM Financial for the acquisition of the Ally Financial international operations ............... (1.3)
Dividends paid ..................................................................................... (0.9)
Decrease in available credit facilities ................................................................... (0.7)
Effect of foreign currency ............................................................................ (0.4)
Other ............................................................................................ (0.3)
Total change in available liquidity ................................................................... $ 1.1
Cash Flow
The following tables summarize automotive cash flows from operating, investing and financing activities (dollars in billions):
Years Ended December 31,
2013 2012 2011
Operating Activities
Net income .......................................................................... $ 4.7 $ 5.6 $ 8.9
Depreciation, amortization and impairments ................................................ 7.6 38.5 7.3
Pension & OPEB activities .............................................................. (0.8) (0.5) (3.0)
Working capital ...................................................................... (0.5) (0.7) (2.2)
Deferred tax valuation allowance release in the U.S. and Canada ................................ — (36.3) —
Other ............................................................................... — 3.0 (3.6)
Cash flows from operating activities ...................................................... $ 11.0 $ 9.6 $ 7.4
Depreciation, amortization and impairments included goodwill impairments of $0.5 billion, $27.1 billion and $1.3 billion and
impairment charges of property and intangible assets of $1.4 billion, $5.5 billion and $0.1 billion in the year ended December 31,
2013, 2012 and 2011. In the year ended December 31, 2012 significant Pension and OPEB activities included contributions to the
U.S. salaried pension plan of $2.3 billion for the purchase of annuity contracts and associated pension settlement charges of $2.7
billion. In the year ended December 31, 2011 significant Pension and OPEB activities included a cash contribution as part of the HCT
settlement of $0.8 billion and a gain associated with the HCT settlement of $0.7 billion. In the year ended December 31, 2012 Other
37