General Motors 2013 Annual Report Download - page 74
Download and view the complete annual report
Please find page 74 of the 2013 General Motors annual report below. You can navigate through the pages in the report by either clicking on the pages listed below, or by using the keyword search tool below to find specific information within the annual report.-
 1
1 -
2
-
3
-
4
-
5
-
6
-
7
-
8
-
9
-
10
-
11
-
12
-
13
-
14
-
15
-
16
-
17
-
18
-
19
-
20
-
21
-
22
-
23
-
24
-
25
-
26
-
27
-
28
-
29
-
30
-
31
-
32
-
33
-
34
-
35
-
36
-
37
-
38
-
39
-
40
-
41
-
42
-
43
-
44
-
45
-
46
-
47
-
48
-
49
-
50
-
51
-
52
-
53
-
54
-
55
-
56
-
57
-
58
-
59
-
60
-
61
-
62
-
63
-
 64
64 -
 65
65 -
 66
66 -
 67
67 -
 68
68 -
 69
69 -
 70
70 -
 71
71 -
 72
72 -
 73
73 -
 74
74 -
 75
75 -
 76
76 -
 77
77 -
 78
78 -
 79
79 -
 80
80 -
 81
81 -
 82
82 -
 83
83 -
 84
84 -
85
-
86
-
87
-
88
-
89
-
90
-
91
-
92
-
93
-
94
-
95
-
96
-
97
-
98
-
99
-
100
-
101
-
102
-
103
-
104
-
105
-
106
-
107
-
108
-
109
-
110
-
111
-
112
-
113
-
114
-
115
-
116
-
117
-
118
-
119
-
120
-
121
-
122
-
123
-
124
-
125
-
126
-
127
-
128
-
129
-
130
 |
 |

GENERAL MOTORS COMPANY AND SUBSIDIARIES
NOTES TO CONSOLIDATED FINANCIAL STATEMENTS — (Continued)
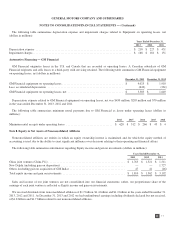
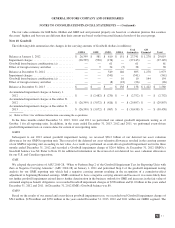
An account is considered delinquent if a substantial portion of a scheduled payment has not been received by the date such payment
was contractually due. At December 31, 2013 and 2012 the accrual of finance charge income has been suspended on delinquent
consumer finance receivables based on contractual amounts due of $642 million and $503 million.
GM Financial purchases consumer finance contracts from automobile dealers without recourse and, accordingly, the dealer has no
liability to GM Financial if the consumer defaults on the contract. Finance receivables are collateralized by vehicle titles and GM
Financial has the right to repossess the vehicle in the event the consumer defaults on the payment terms of the contract.
The following table summarizes the contractual amount of delinquent contracts, which is not materially different from the recorded
investment of the consumer finance receivables (dollars in millions):
December 31, 2013 December 31, 2012
Amount
Percent of
Contractual
Amount Due Amount
Percent of
Contractual
Amount Due
Delinquent contracts
31-to-60 days .......................................................... $ 952 4.1% $ 672 6.1%
Greater-than-60 days .................................................... 408 1.7% 230 2.1%
Total finance receivables more than 30 days delinquent ......................... 1,360 5.8% 902 8.2%
In repossession ......................................................... 41 0.2% 31 0.3%
Total finance receivables more than 30 days delinquent or in repossession .......... $ 1,401 6.0% $ 933 8.5%
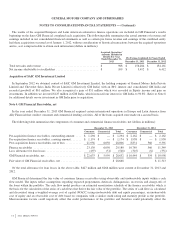
Impaired Finance Receivables — Troubled Debt Restructurings
The following table summarizes the outstanding recorded investment for consumer finance receivables that are considered to be
TDRs and the related allowance (dollars in millions):
December 31, 2013 December 31, 2012
Outstanding recorded investment ................................................... $ 767 $ 228
Less: allowance for loan losses ..................................................... (103) (32)
Outstanding recorded investment, net of allowance ..................................... $ 664 $ 196
Unpaid principal balance .......................................................... $ 779 $ 232
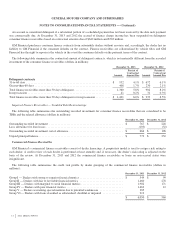
Commercial Finance Receivables
GM Financial’s commercial finance receivables consist of dealer financings. A proprietary model is used to assign a risk rating to
each dealer. A credit review of each dealer is performed at least annually and, if necessary, the dealer’s risk rating is adjusted on the
basis of the review. At December 31, 2013 and 2012 the commercial finance receivables or loans on non-accrual status were
insignificant.
The following table summarizes the credit risk profile by dealer grouping of the commercial finance receivables (dollars in
millions):
December 31, 2013 December 31, 2012
Group I — Dealers with strong to superior financial metrics .............................. $ 549 $ 99
Group II — Dealers with fair to favorable financial metrics .............................. 1,460 278
Group III — Dealers with marginal to weak financial metrics ............................. 1,982 171
Group IV — Dealers with poor financial metrics ....................................... 1,462 12
Group V — Dealers warranting special mention due to potential weaknesses ................ 385
Group VI — Dealers with loans classified as substandard, doubtful or impaired .............. 212
$ 6,050 $ 560
72
2013 ANNUAL REPORT